MAE3 Team Energy Analysis Worksheet A key component of the robot project is to integrate creativity with engineering analysis. Energy analysis is one useful method for evaluating resources available for the project. The law of energy conservation dictates that any design does not require more energy than it has available to it. In this energy analysis each team will quantify how much energy and power is available from each energy source in the kit. This analysis will:
Energy Sources in the Kit Included in Worksheet Analysis
Other Energy Sources in kit (but not required for worksheet analysis)
Assignment DetailsEach team should complete this worksheet by measuring values in the lab, and performing the analysis. In addition, Individual components are to be split up among team members for their individual energy analysis. Show details of work neatly. DefinitionsEnergy:
Power:
Work (Mechanical Energy Transfer) Work, W, is a transfer of energy. Mechanical energy can be transferred by applying a force or torque over a distance of motion. If there are no energy losses in the system then the chance of energy δΕ=W
W = Distance over which force is applied X Force in direction of motion (units of Nm)
W = Torque x radians of rotation (units of Nm) Energy and Power: A Necessary but NOT Sufficient Condition For a machine to function it is necessary that enough energy and power be provided to meet its needs. However, this is NOT a sufficient condition to guarantee motion. One must also analyze the forces and torques on individual components, to determine if the desired motion will indeed occur. Force and Torque Output in Mechanism Design Gears, levers, pulleys, and other mechanisms can be used to increase or decrease the force or torque output of a machine, while also changing the velocity output (see Mechanical Devices text Chapter 1). Since force and torque are not conserved, an energy source with low force output can be configured to provide higher force at the expense of a lower velocity output. This subject will be covered in more depth in a lecture on Mechanical Advantage. Units Unit conversion errors have lead to loss of spacecraft, and airplanes running out of fuel (see stories on www.maelabs.ucsd.edu under Tutorials => Engineering Analysis => Unit Conversions) Unit conversions should be done carefully by clearly multiplying by values that have the physical quantity of one. For example, to convert revolutions per minute to radians per second as follows: 60 seconds = 1 minute 1 revolution = 2π radians In this worksheet, metric units are used with the following notation: Force => Newtons (N) Distance => meters (m) Time => seconds (s) Mass => kilograms (kg) Torque => Newton meters (Nm) Angular rotation => radians (radians is a ratio and has no units) Angular velocity => radians/second NOTE: 1 in = 2.54 cm = .0254 m Potential Energy from GravityGravitational energy can be added to your machine if there is a change in the height of the center of mass of the machine. The potential energy due to gravity is given by:
The quickest that potential energy can be released is during a free fall (i.e. no friction). The fall time is given by: Make estimation for realistic values for the maximum potential energy from gravity your machine can use during the contest (assume half the entire kit’s mass can be used for potential energy, and the height change is the starting height of your robot)
Kinetic EnergyEach MAE3 machine starts at rest, and thus has no kinetic energy at the start time. However, energy may be transferred to the machine during the contest, so the equation for kinetic energy is useful for estimating energy requirements. A moving point mass has a total kinetic energy of:
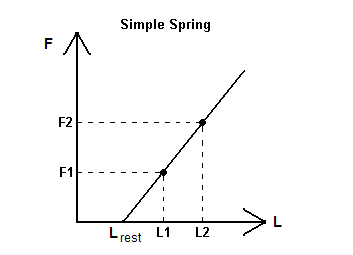
Spring and Rubber Band AnalysisA spring (a rubber band is a type of spring), provides a restoring force in proportion to the distance it is extended, i.e. the more one stretches a spring the larger the restoring force. The simplest springs have the following linear relationship:
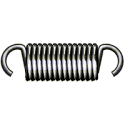
where, Fspring => is the force applied by the spring k => is the spring stiffness Lrest => Rest length of spring, when no load is applied to it Linital => Initial length of spring, which is equal to Lrest only for springs with no pretension Lspring => Length of spring when under load δx => is the spring elongation; δx=Lspring-Lrest Compression vs. Tension Compression springs are designed to experience compressive forces and therefore become shorter when loaded. There are gaps between each turn in the unloaded position to allow them to be compressed (see Figure 1). While compression springs can theoretically be in tension, they are generally not used for that purpose. Figure 1: Compression Spring Tension springs are designed to experience tension forces and therefore become longer when loaded. Typically there are no gaps between the turns when they are unloaded (see Figure 2), and many tension springs are manufactured under an initial pretension. This means that the length of the spring will not be displaced unless the magnitude of the tension force is greater than the initial pretension force. Unlike compression springs, tension springs do no have the ability to be used in both compression and tension. Figure 2: Tension Spring with pretension caused by contact forces between coils .Measuring Spring StiffnessAn easy way to measure a spring’s stiffness is to hang weights from it and measure the spring elongation. However, there are a few important factors to consider:
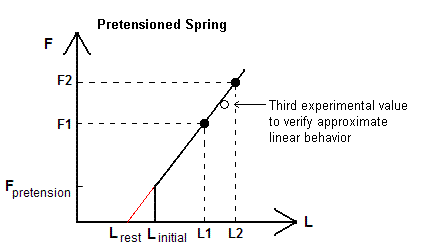
Measure the spring stiffness by applying two loads on the spring and measure spring displacements. As shown below, a spring with pretension will have an Lrest which is different than Linital. The red segment shows the theoretical region of the spring if it was not pretensioned.
A minimum of two points is required to calculate a slope. Ideally, more points should be measured and a slope can be calculated using a least squares fit. For the purposes of this worksheet, only two points are needed to obtain an approximate stiffness value. The following formula can be used to calculate the stiffness k. For springs with pretension the rest length must be calculated by first finding the equation of the line that fits the spring curve. The equation of the line can be written as: .Lrest can then be found by finding the point on the curve where F=0 (by definition of Lrest). Solving for Lrest: The theoretical equation for the energy stored in a spring is given by:
For springs with pretension, one cannot recover energy in the regions where the coils touch, and therefore:
Use weights, rulers, and spring scales to fill out the following sheet for each spring and rubber band in the kit:
* Rubber Band Max Length: measure the length (we use different rubber bands each quarter). Do not damage your springs by extending them beyond their elastic limit. See Posted Sheet above the torque measurement devices for the Spring Max Lengths. ** Spring Release Time The energy release time of a spring can be difficult to calculate accurately, since it depends on the applied load and happens relatively quickly. One way to get a rough estimate of the release time is from observation (it is less than a second!). A more accurate estimate can be made using spring dynamics. If one of the team members has taken MAE130B, the team should use the method below. To perform work the spring will be attached to mass and will accelerate that mass. Choose a mass of a kit part the spring will move (in initial estimates one typically neglects the mass of the spring). If the spring is attached to the mass, stretched, and released; then the mass will oscillate back and forth. The frequency of vibration, ω, is given by:
where macc is the mass that is being accelerated (not the spring mass!) in kg. The period of one cycle of vibration is given by: T = 2π/ω seconds However, it takes only one quarter of cycle for the mass to move from a point where the spring is at maximum compression and the mass is at zero velocity (all the energy is in the spring) to the point where the spring is at rest but the mass is at maximum velocity (all the energy is in kinetic energy). Therefore, the energy release time is T/4. Experimental Validation Oftentimes, physical parameters can be measured more than one way. Using multiple methods of finding the same parameter is a useful means for validating the accuracy and validity of a measured value. For springs, the stiffness constant can also be estimated from free oscillation of known mass, where
Use the mass-spring setup in the lab to verify the spring stiffness of the small rubber band and the medium spring.
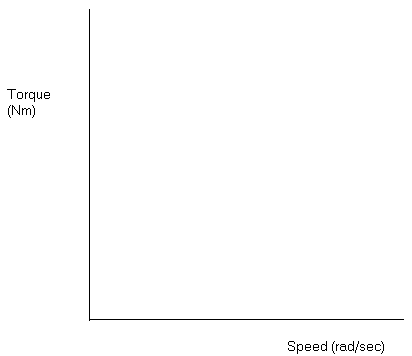
Energy and Power of DC Motors Every motor outputs a torque that varies as a function of motor speed. The motors in the robot kit are permanent magnet motors, and there is a linear relationship between the motor speed and torque (see Mechanical Devices text, Chapter 7). With no load on the motor, the shaft rotates at its maximum speed, referred to at the “no load speed.” As torque is applied to the shaft the torque the motor slows down, unit the torque reaches the “stall torque” at which point the motor stops rotating. The torque speed curve of DC Permanent magnet motors is a straight line, but other types of motors have different shape curves. Measure the “no load speed” of both the geared and non geared motors. Use a stop watch for the geared motor, and the optical sensor setup for non geared motor that rotates too fast to count by hand. Also measure the stall torque using the setup in the lab. Show the torque and speed calculations on a separate sheet. Plot the straight line torque speed curves for both motors below. The power output for a motor is given by the torque, τ, times the angular velocity, ω (in radians per second):
By looking at torque speed curve one can see that the power output is zero when the motor is stalled, and zero when the motor spins with no torque output at its “no load speed.” The maximum torque output occurs when the motor is operating at the midpoint of its operating range, where the speed is half the “no load speed” and the torque is half of the stall torque (for a proof take the derivative of the power). The power is equal to δE/δtime. Thus the energy output of a motor is:
The maximum amount of rotation that can occur in the robot contest is the angular speed at multiplied by the contest duration (60 seconds)
Motor Power and Energy Table
.Summary of All Energy Sources
From the above table find the components that provide the maximum output in each category. List these components below and describe briefly what these components are especially useful for based upon their force, power, and energy output.
|
|
|