Embedded Files
SAFETY IN THE LABORATORY - DO YOU KNOW ?
SAFETY IN THE LABORATORY - DO YOU KNOW ?
Rules to Follow:
Be aware of what you are doing in the laboratory.
Read the method carefully before you start a practical.
Always think of others and behave sensibly.
Do not enter the laboratory unless you are with your teacher.
Never touch any equipment or chemical in the laboratory without your teacher's permission.
Eating and drinking is not allowed in the laboratory.
Do not run- always walk.
Always wear safety glasses, closed shoes and protective clothing.
Tie back long hair.
Never taste chemicals.
Mop up any spills.
REPORT ALL ACCIDENTS/BREAKAGES TO THE TEACHER IMMEDIATELY.
Know where the sand bucket and fire extinguiser is.
Don't use paper to light Bunsen burners, and don't put burning things in the rubbish bin.
Always point test tubes away from people.
Check with your teacher on how to dispose of waste liquids and solids. Broken glass should be placed in a special bin.
After heating equipment, let it cool down before picking it up. This will avoid burns.
Clean all equipment after use and put it back after doing practicals.
First Aid For Accidents:
Eye injuries can be caused by liquids splashing into your eyes during experiments. Always wear your safety glasses. Also never point a test tube towards your face or anyone else's.
Poisoning can be caused by breathing in fumes during an experiment, eating chemicals or by spilling them onto your skin. Do not eat or drink in the lab.
Cuts are caused by broken glass, so make sure any broken glass goes into the labelled bin.
Burns can be caused by touching hot equipment, or by spilling hot liquid when someone bumps you. Treat burns with cold running water. Serious burns can occur with a Bunsen burner. If this happens, tell your teacher at once.
Fires are always possible when using burners. It is essential to tie back long hair whenever you are using a burner.
Damage to clothing and skin can occur when chemicals especially corrosive liquids such as acids and alkalis, are spilt. If there is a spill, wash the area immediately with lots of water and send someone to tell the teacher. In the most serious cases you may need to use the safety shower.
Damage to the laboratory can occur when sinks become blocked with paper or solids, which can cause flooding if the taps are left running. The benches can also be scorched during heating. They can also be damaged by chemical spills, so wipe these up immediately.


THE ROLE OF HAZARDOUS SYMBOLS ON REAGENTS
THE ROLE OF HAZARDOUS SYMBOLS ON REAGENTS
LABORATORY (LAB) EQUIPMENT AND ITS USE
LABORATORY (LAB) EQUIPMENT AND ITS USE


USING A BUNSEN BURNER SAFELY
USING A BUNSEN BURNER SAFELY

PARTS OF THE BUNSEN BURNER
PARTS OF THE BUNSEN BURNER

More resources on Bunsen Burner for you to explore!

Steps to lighting a Bunsen burner
Steps to lighting a Bunsen burner
Put on safety glasses
Put the Bunsen burner on a heating mat
Connect the gas tube to the gas tap
Close the air hole by turning the collar
Strike a match and hold it over the top of the barrel
Turn on the gas at the gas tap
When the gas lights, open the air hole until a blue or clear flame forms
If the Bunsen burner goes out, turn off the gas and start again
When using a Bunsen burner, set it to a blue or clear flame. If you wish to leave your Bunsen burner going while you do some work or collect more equipment, close the air hole so that you have the yellow or safety flame.
To heat liquids in a test tube, you use a test tube holder. The test tube needs to be held near to the top, and tilted on an angle so that only the bottom of the test tube is in the Bunsen burner flame.
The top of the test tube must always be pointed away from other students when heating, and you must stop if the liquid you are heating starts to boil.


SAFETY FLAME HEATING FLAME
MEASUREMENT SKILLS
MEASUREMENT SKILLS
The process of science involves observation, investigation and testing. Scientific observations can be made directly with our own senses or may be made indirectly through the use of equipment to collect data. Being able to take accurate measurements is important. The units and type of equipment used depends on whether you are measuring length, volume, temperature or mass.

1kg = 1000g 1m= 100cm 1000mm=1m 10mm = 1cm 1min = 60secs
Volume- is a measure of the amount of space an object occupies
measured in millilitres or litres
1000ml = 1l
1000ml = 1l


READING THE MENISCUS CORRECTLY


DIFFERENT METHODS OF SCIENTIFIC INVESTIGATION
DIFFERENT METHODS OF SCIENTIFIC INVESTIGATION
1) PATTERN SEEKING
1) PATTERN SEEKING
- involves observing and recording natural events, carrying out investigations or noticing a pattern in existing data

2) MODELLING
2) MODELLING
- a MODEL IS A REPRESENTATION OF AN OBJECT OR SYSTEM. IT CAN BE USED TO MAKE PREDICTIONS AND OR EXPLAIN OBSERVATIONS
- a MODEL IS USED IN SCIENCE TO HELP EXPLAIN HOW SOMETHING WORKS OR DESCRIBE HOW SOMETHING IS STRUCTURED

EXAMPLE OF SOME MODELS:


3) fair testing
3) fair testing

In a fair test you should only change the independent variable!

4) researching
4) researching
- is using the scientific method to find out about something or find answers to the research question

5) identifying and classifying
5) identifying and classifying
- Identification involves describing something in enough detail so that it could be recognised in a given context
- Classifying is an investigative approach that involves sorting objects or events into groups or categories.


CLICK ON TO EXPLORE AND LEARN MORE!

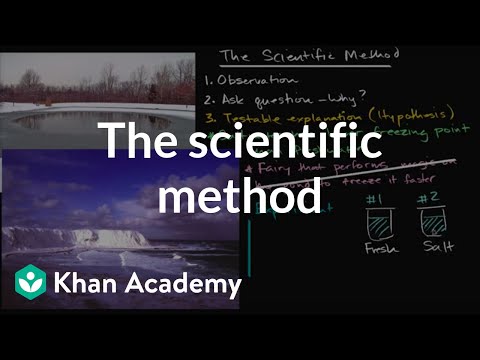
THE SCIENTIFIC METHOD
THE SCIENTIFIC METHOD

TYPES OF VARIABLES in a fair test experiment
TYPES OF VARIABLES in a fair test experiment


GRAPHS AND TABLES
GRAPHS AND TABLES
Tables and graphs are visual representations used to collect, record and anlyse data. They are used to organise information to show patterns and relationships. A graph shows this information by representing it as a shape. Researchers and scientists often use tables and graphs to report findings from their research. In newspapers, magazine articles, and on television they are often used to support an argument or point of view.
VARIABLES ON A GRAPH
The independent variable makes the x-axis (horizontal line) of the graph and the dependent variable makes the y-axis (vertical line).

TYPES OF GRAPHS
BAR GRAPHS
A bar chart or bar graph is a chart or graph that presents categorical data with rectangular bars with heights or lengths proportional to the values that they represent.
2. LINE GRAPHS
Line graphs are used to track changes over short and long periods of time.

3. HISTOGRAM
is a graphical display of data using bars of different heights

Page updated
Google Sites
Report abuse