Embedded Files

Page last updated: September 2010 by Kiran Nevaskar
Kit Details
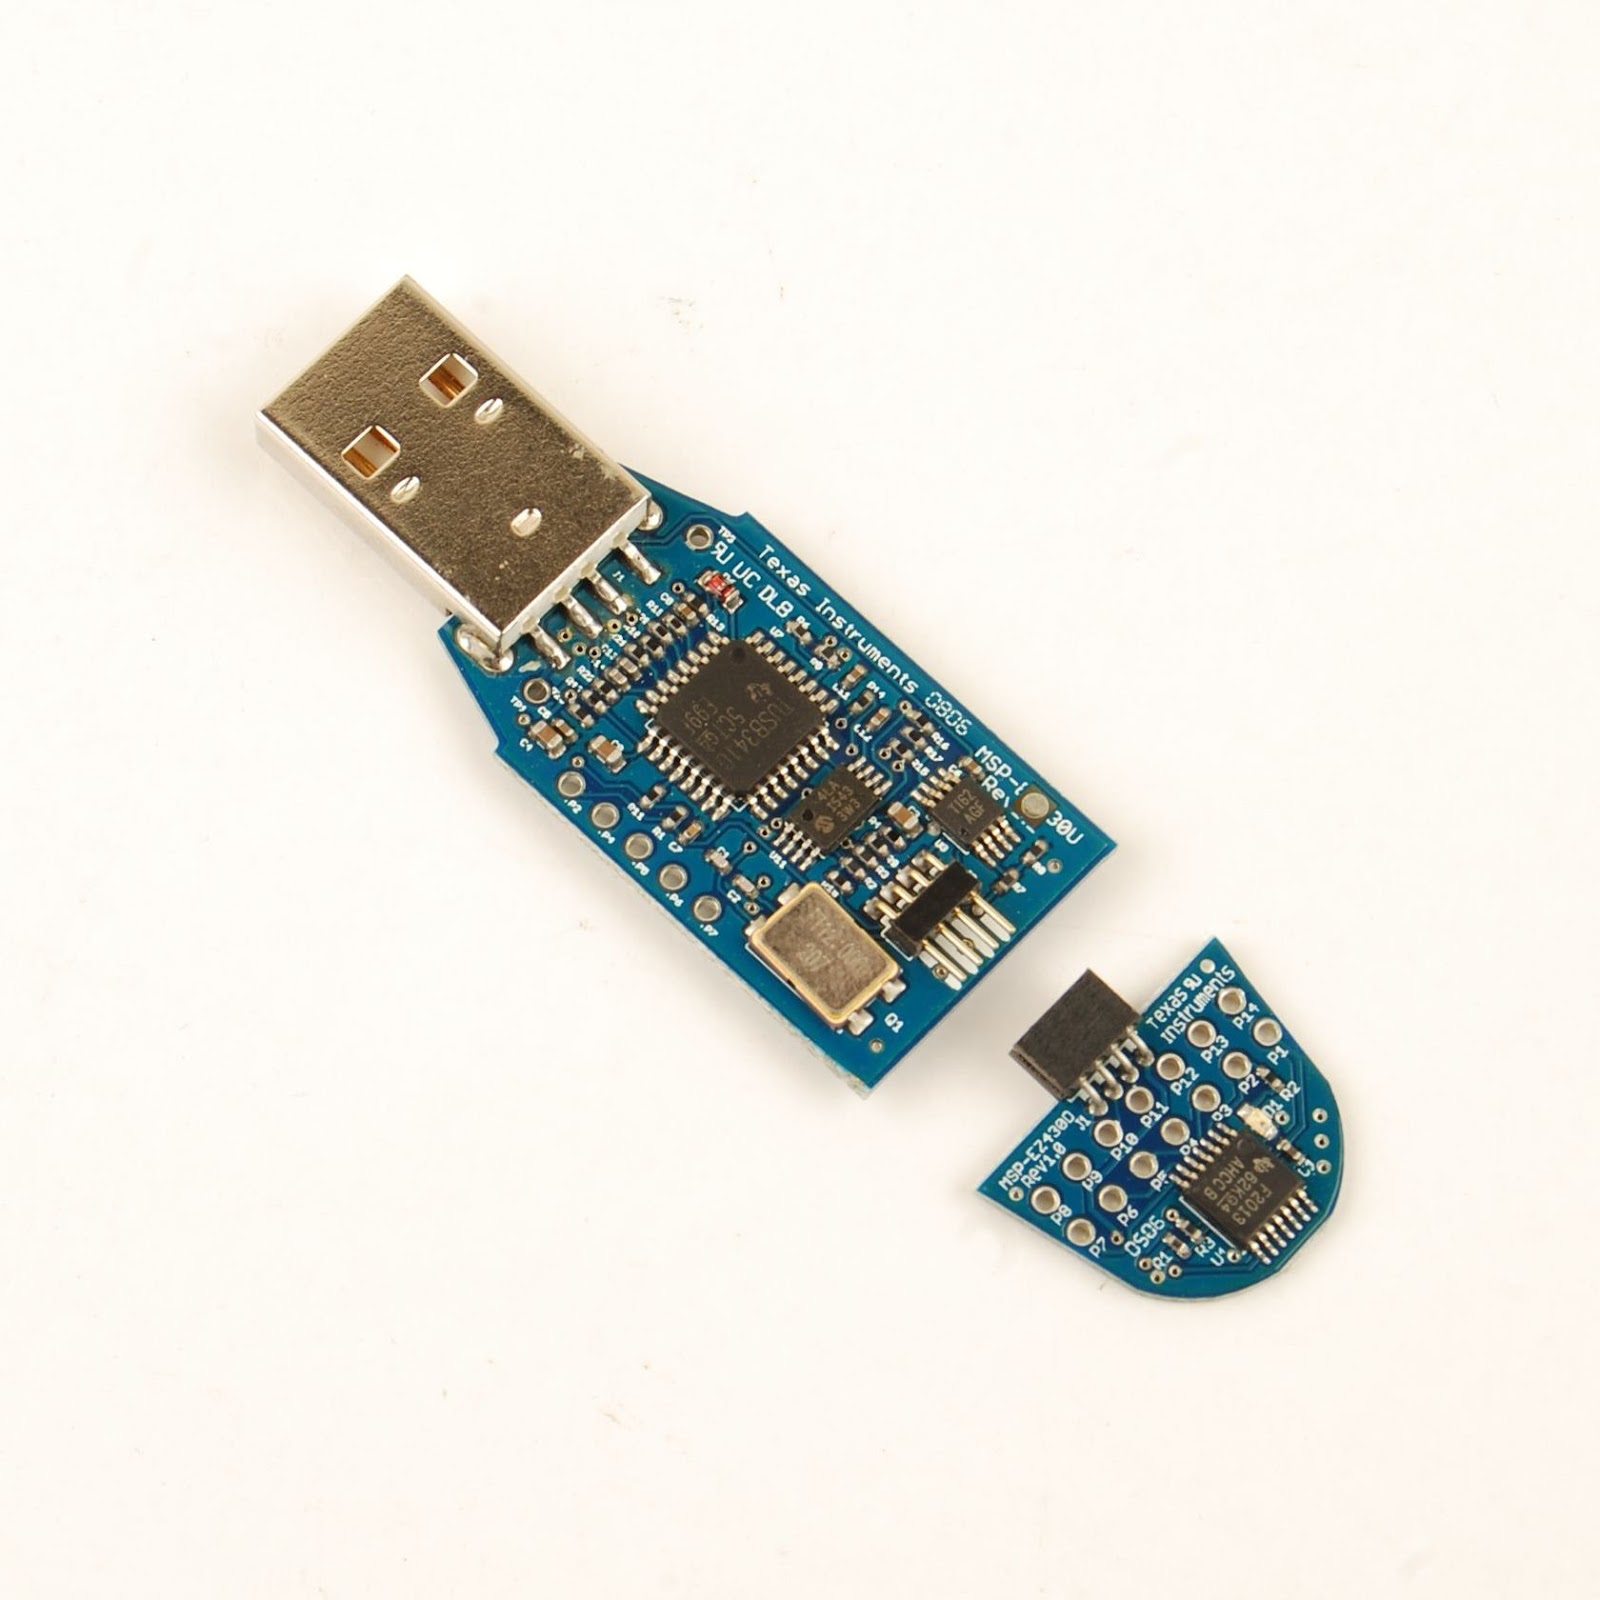
Kit Name: EZ430-F2013
Onboard Microcontroller: MSP430F2013
Microcontroller Type: 16-bit
Official kit companion site: MSP430 USB Stick Development Tool
Kit Price (Approx): USD 20
Buy Kit: TI e Store
Software Development Tools
We have used:
C Compiler: IAR Embedded Workbench KickStart (4KB Limited) Download
Assembler: built into IAR
IDE: built into IAR
Programmer/Debugger: built into IAR
Operating System: Microsoft Windows 7 32-bit
Other Kits

Step 01 - Install IAR
Double click on setup to start installation:

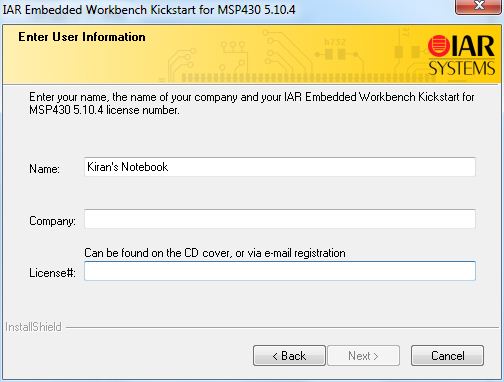
Enter user information and License code. After registering on website of IAR this code can be obtained:
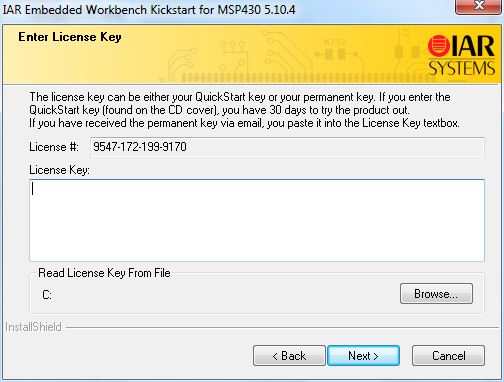
Enter License key which comes along with License no:
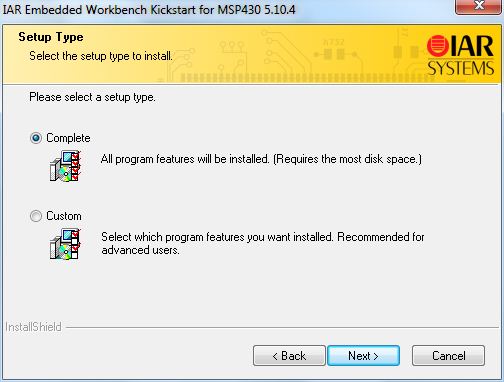
Select setup type as Complete:
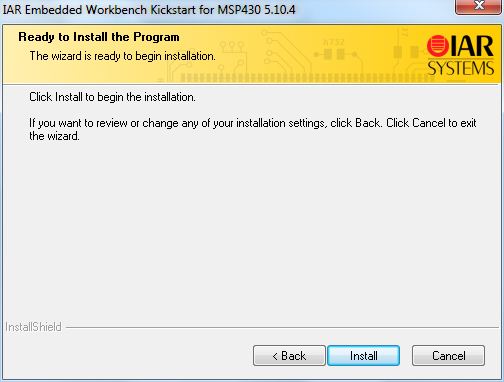
Click on Install to start installation:
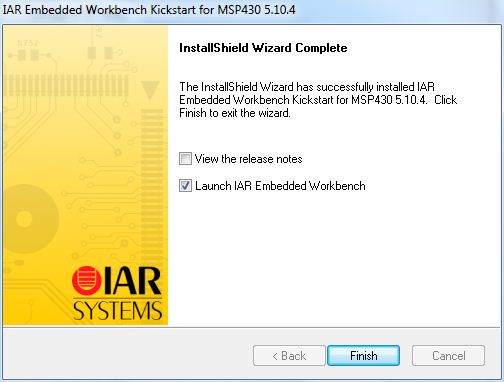
Click on finish to start IAR Workbench:
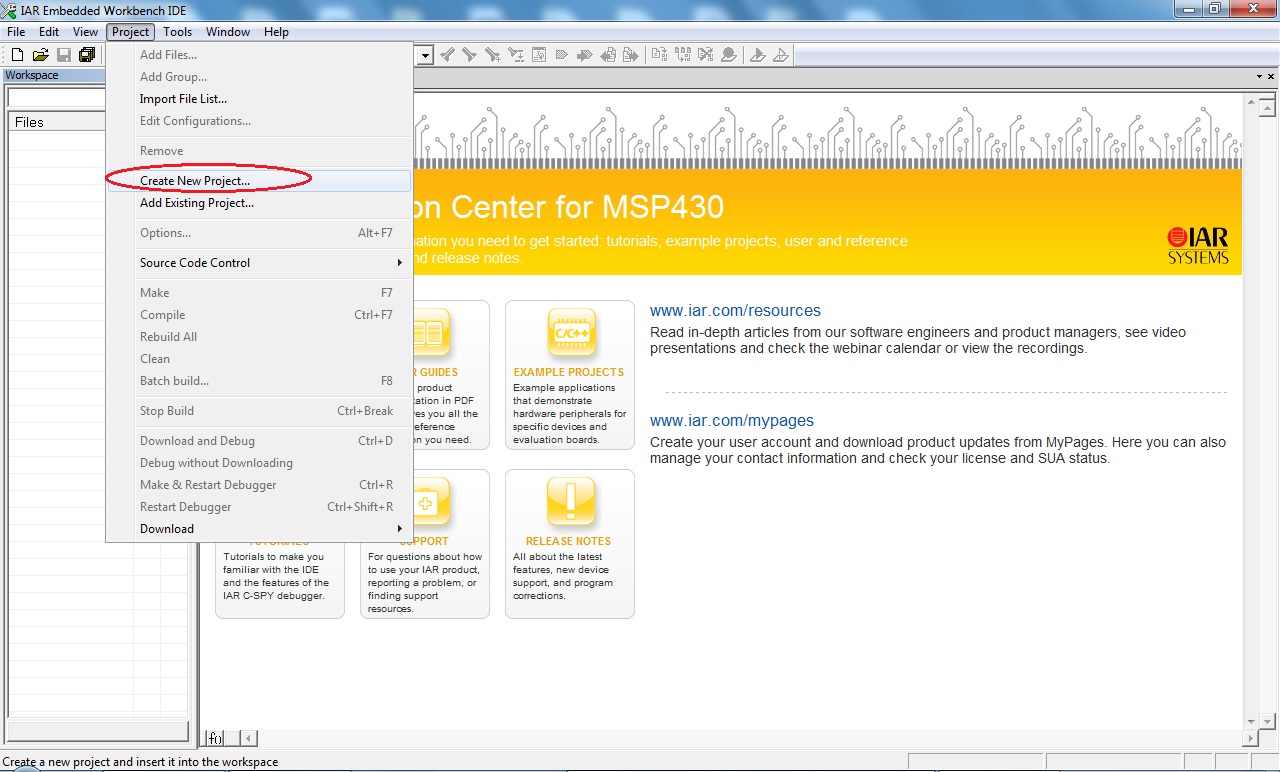
Step 02 - Create a new Project
Create new project from Project Menu:
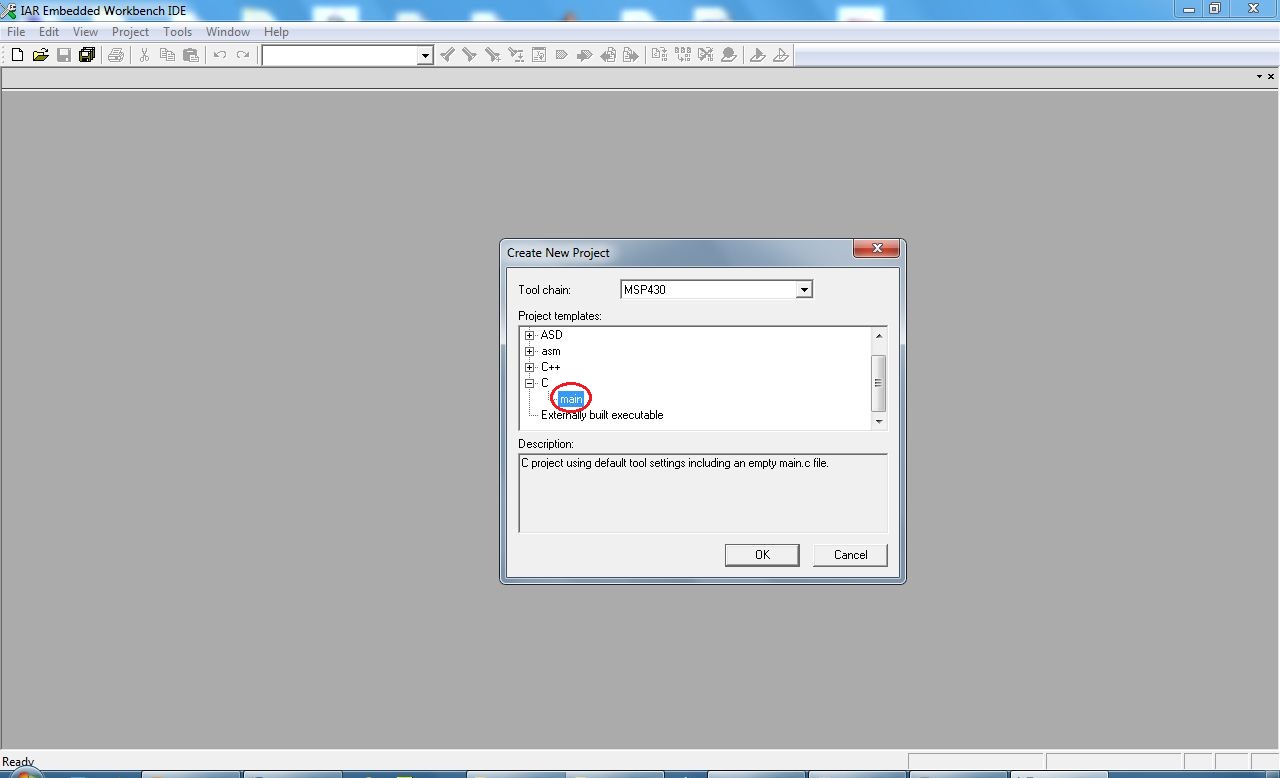
New Project Window will look like this:
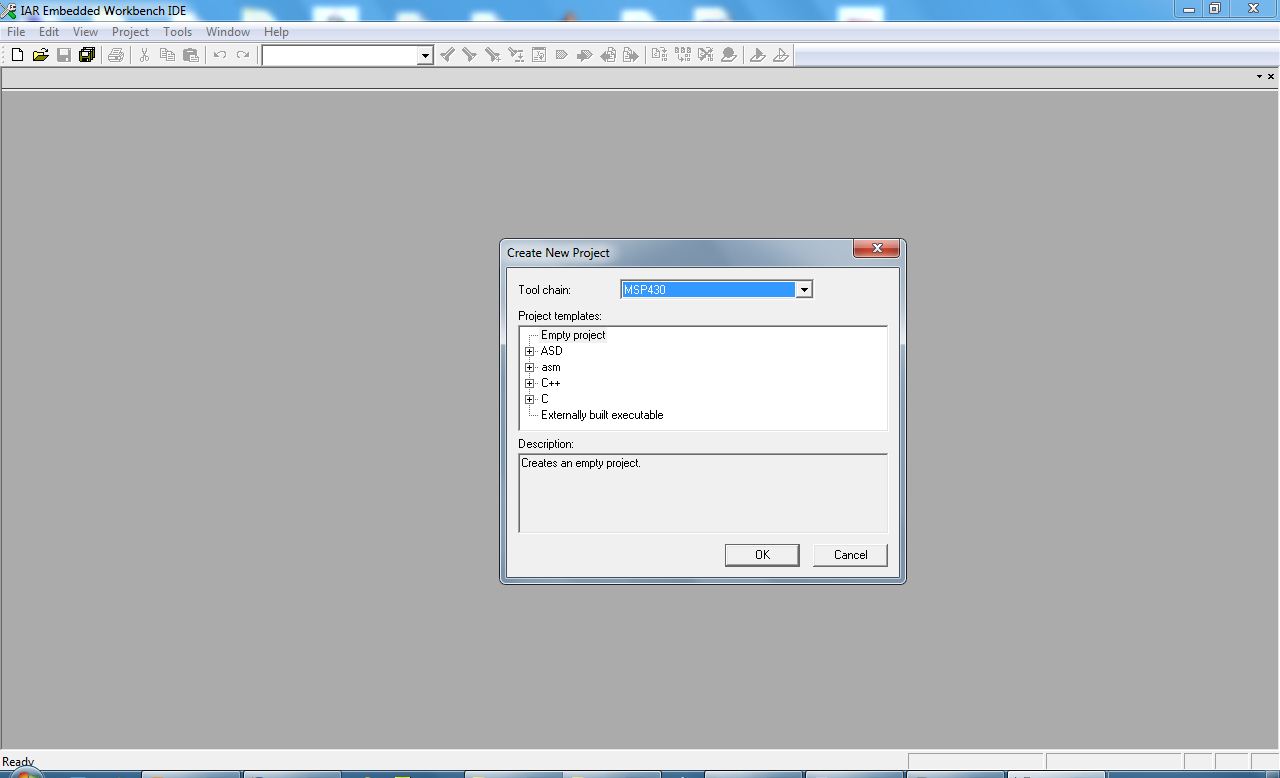
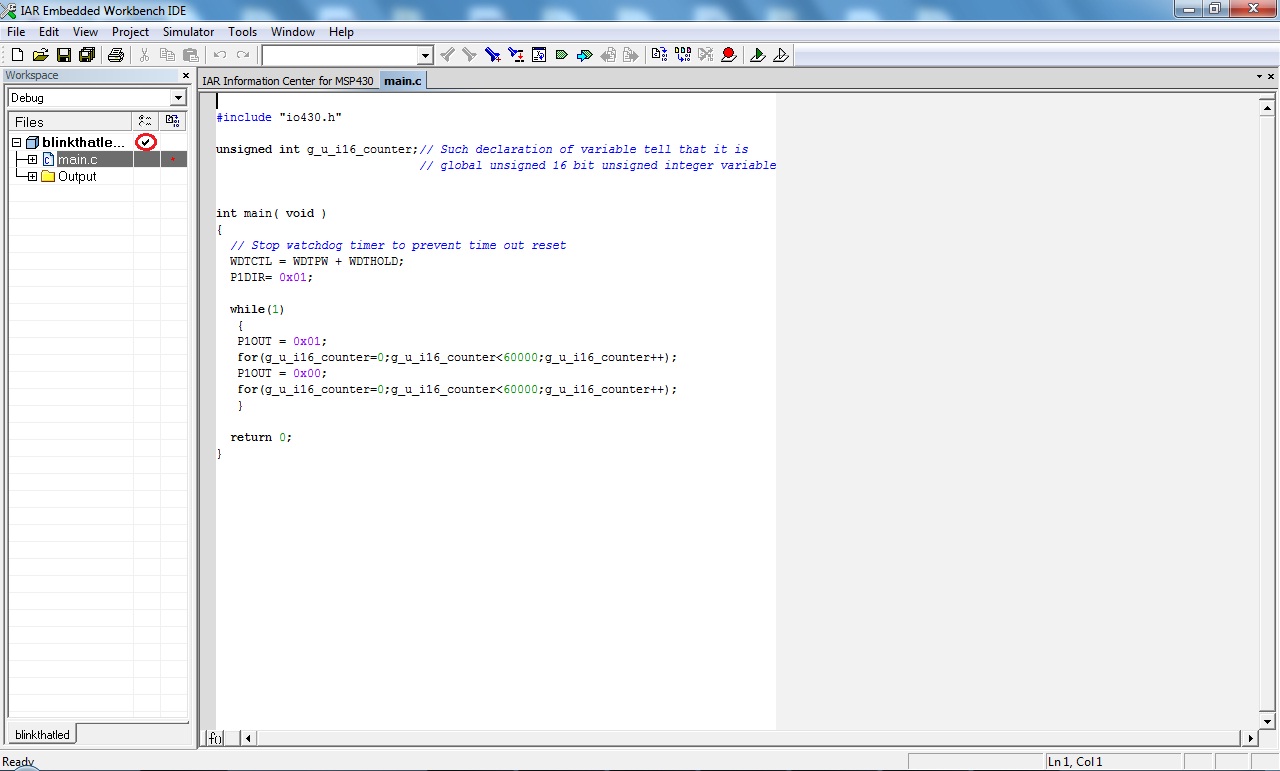
In this window Main under C. This will create Code file with basic template and main function it the code file:
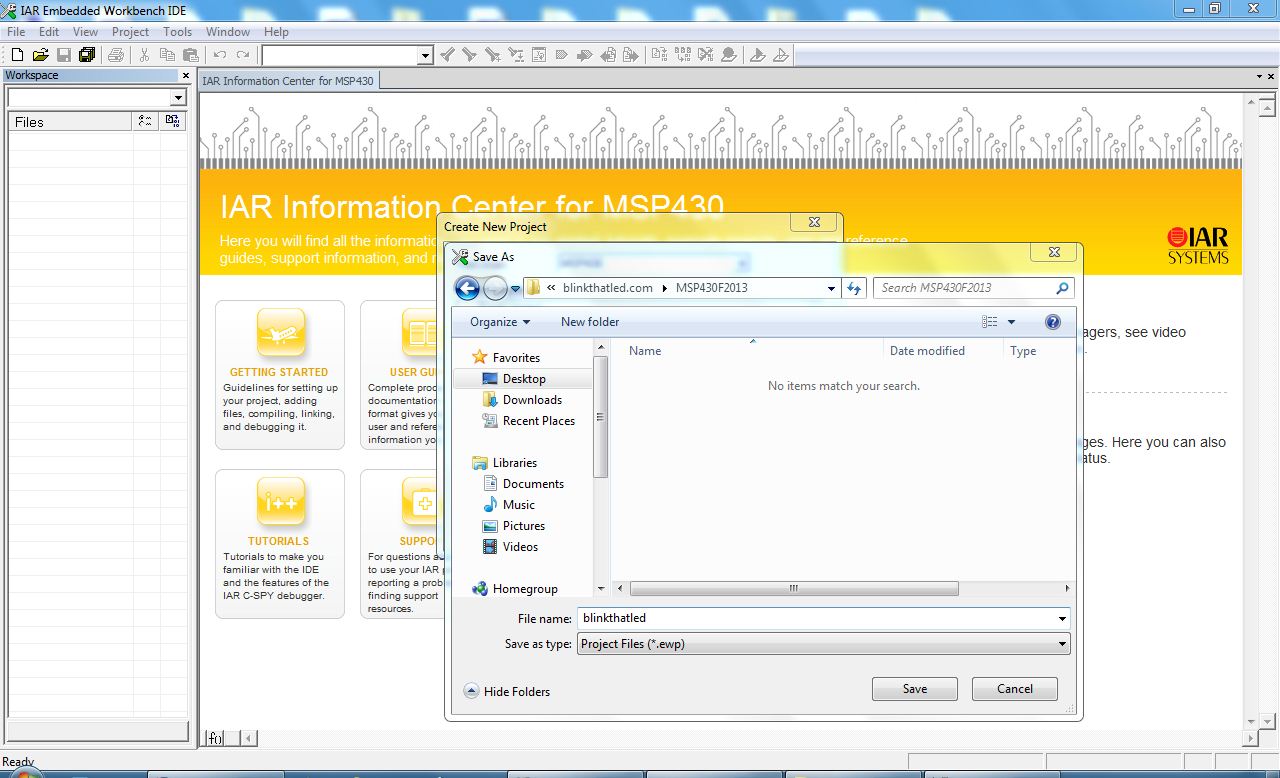
Create folder, browse that folder and enter project name:
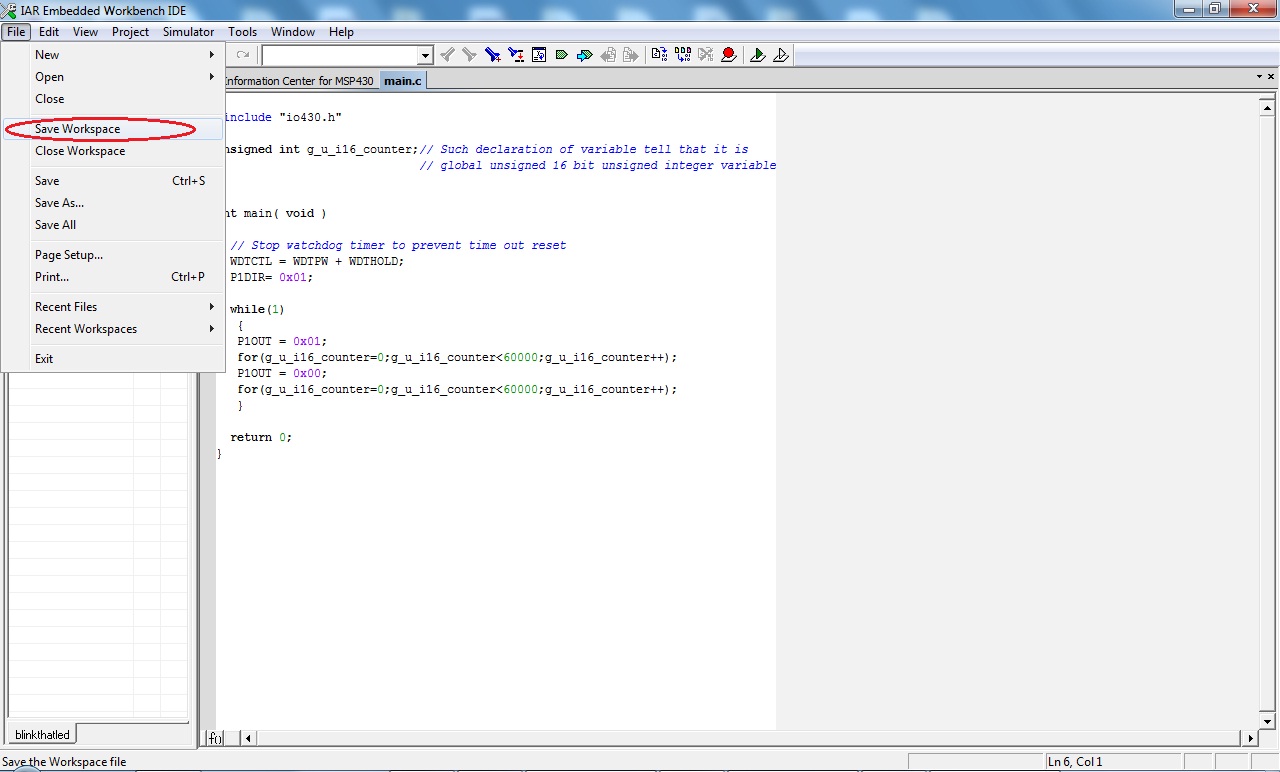
Save workspace from File Menu:
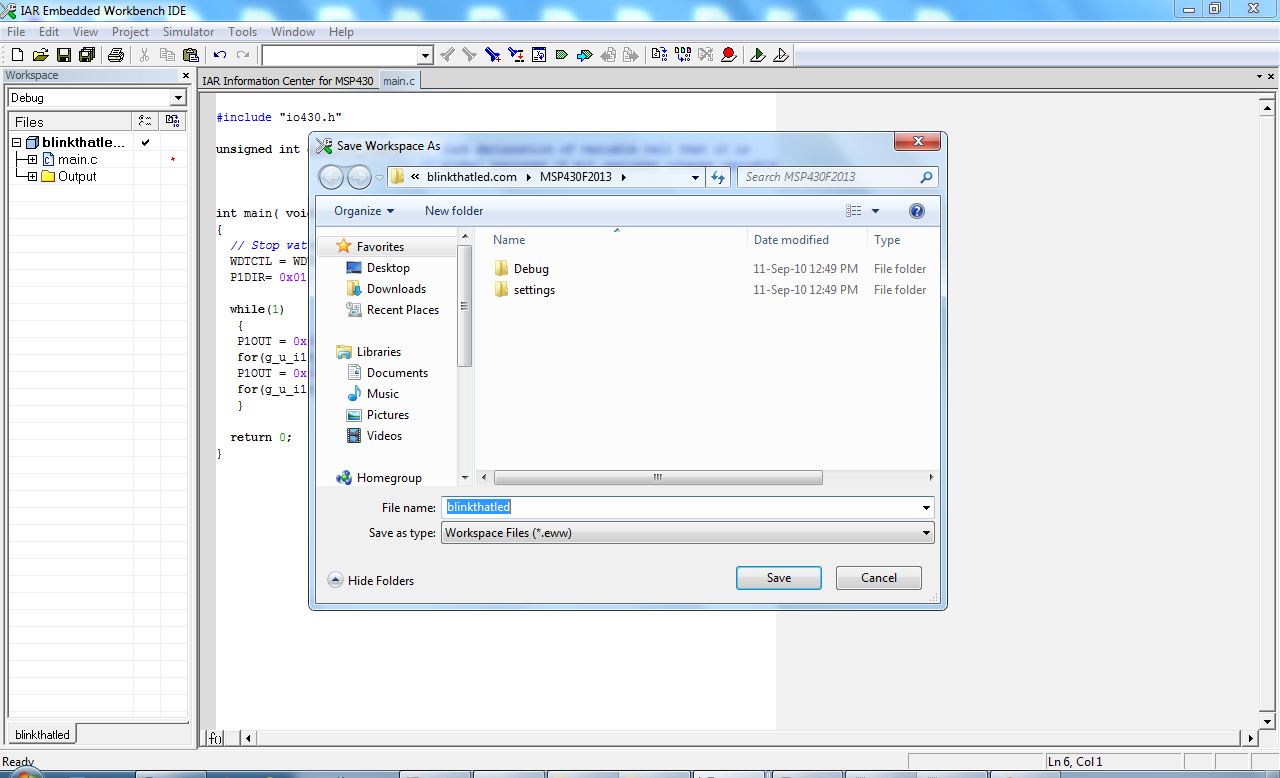
Enter workspace name:
Step 03 - Create new source file and Compile
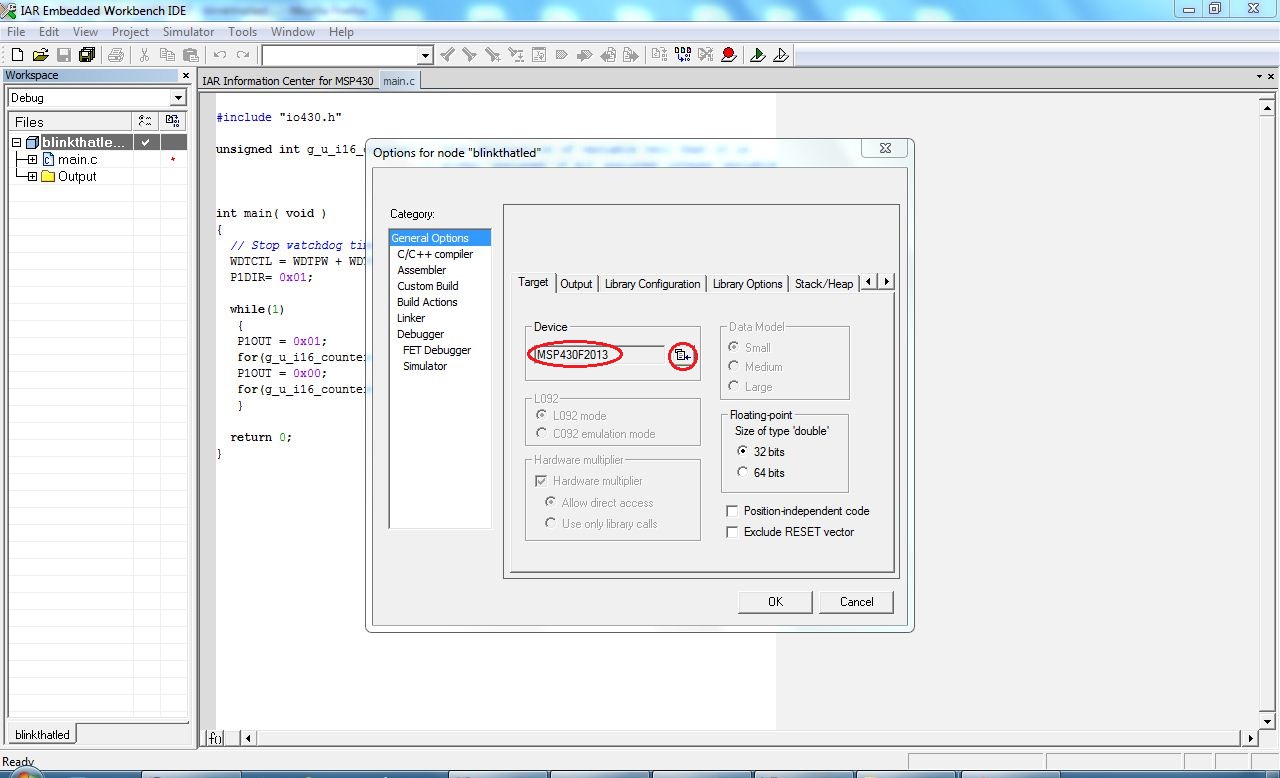
Double click on Tick mark to open project options:
Select Target as MSP430F2013:
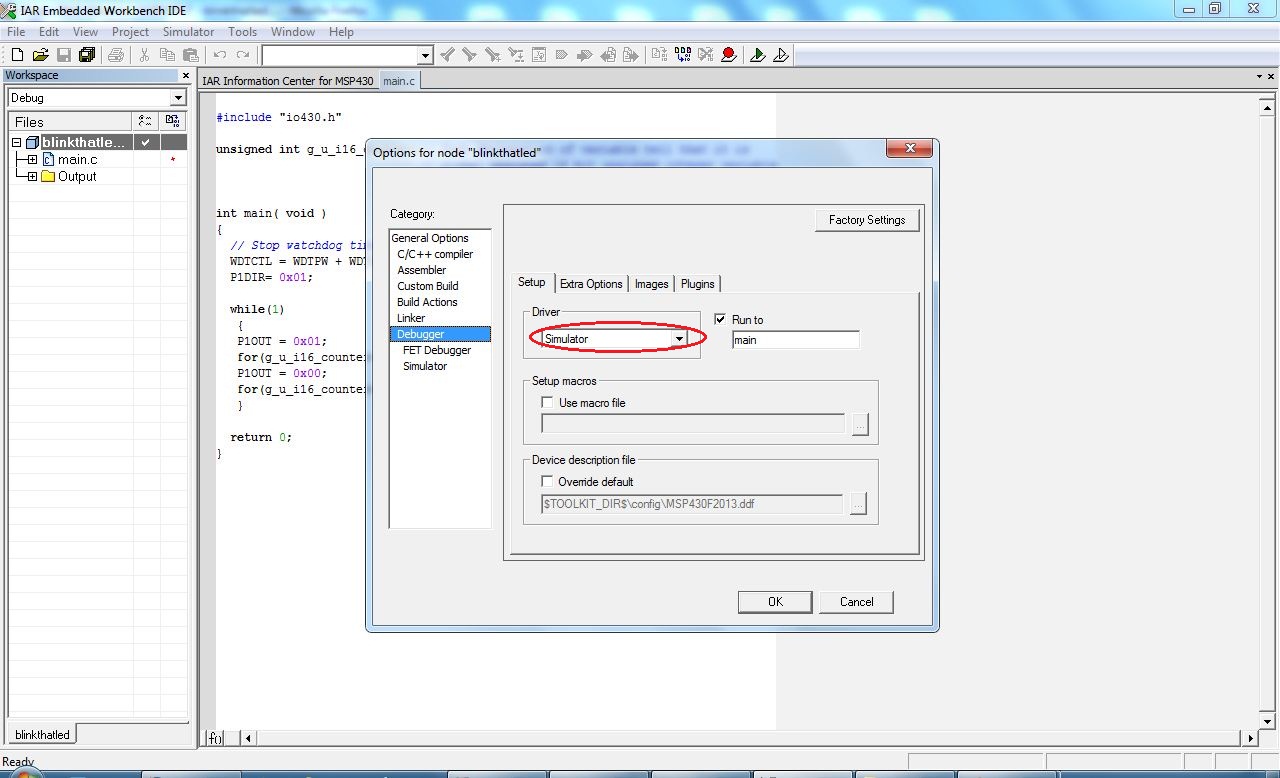
Under Debugger option Select Debugger as simulator:
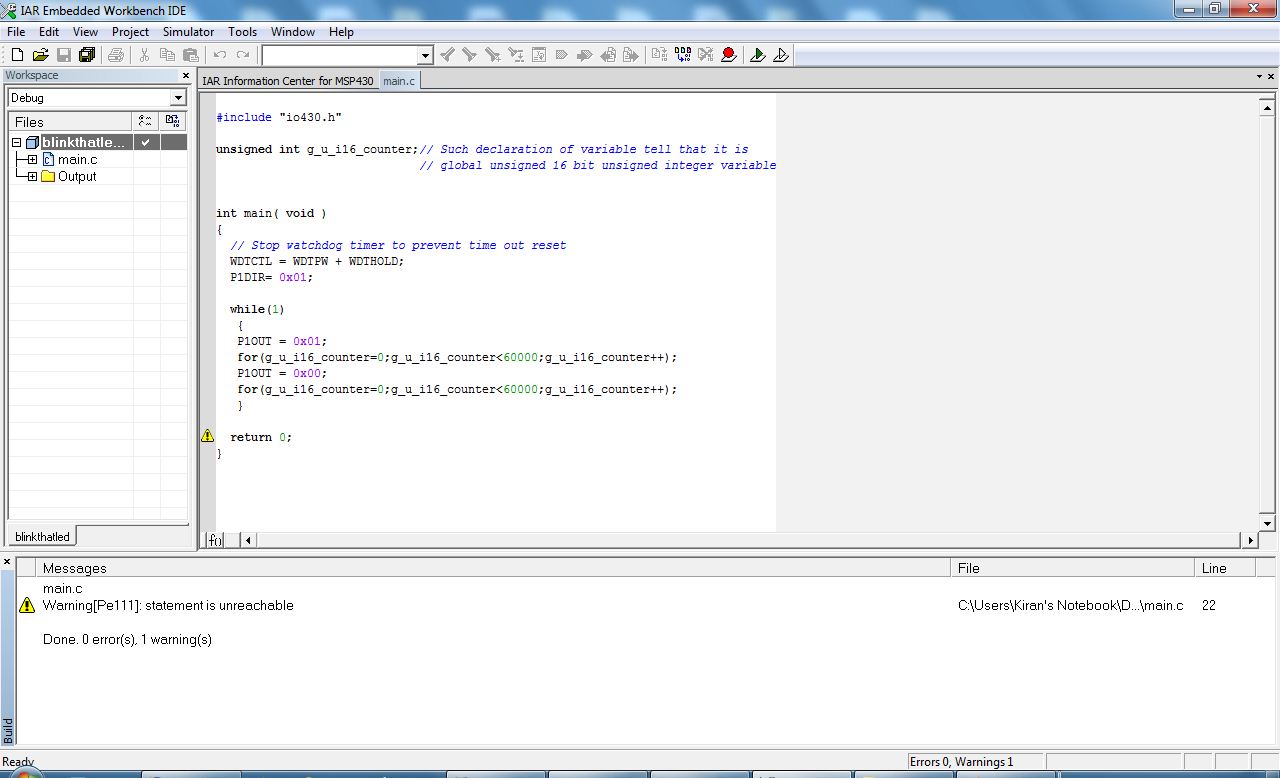
Click on Code window and then Click on Project->Compile:
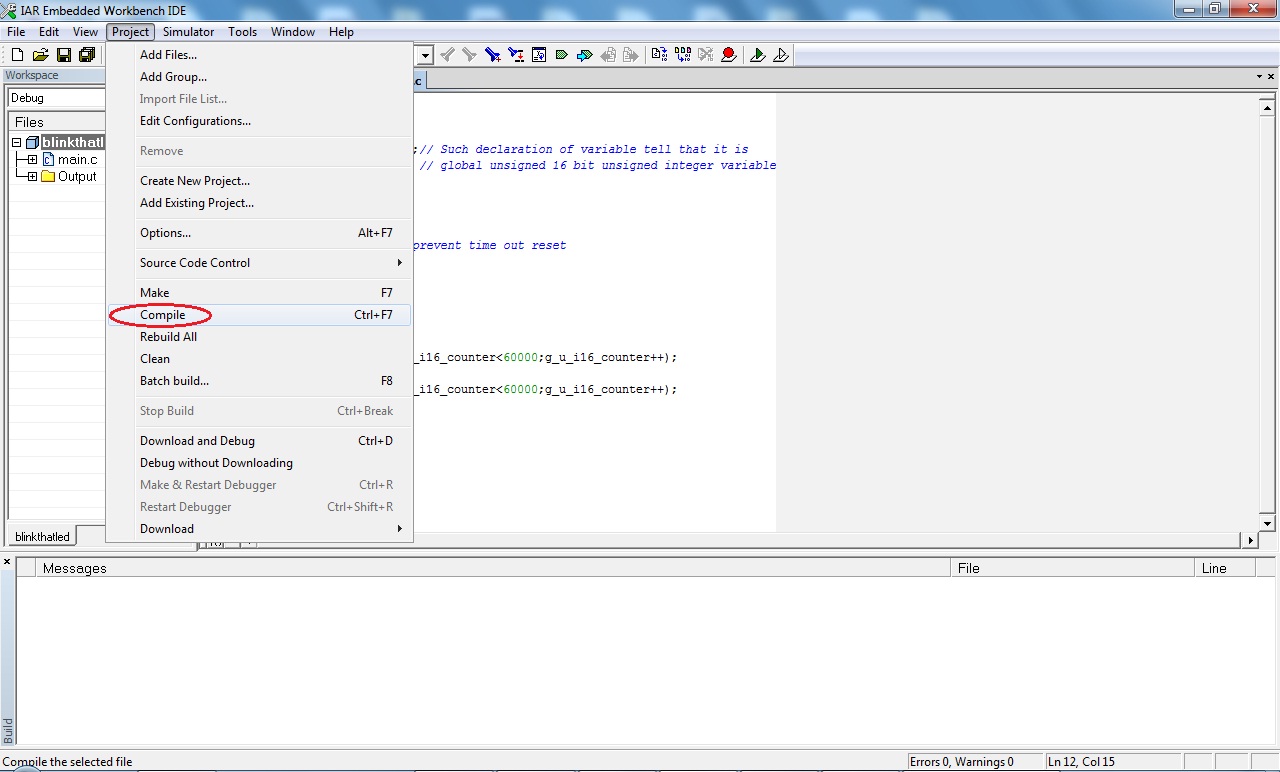
Compilation will be successful if code doesn't have any error:
Step 04 - Simulation & Debugging
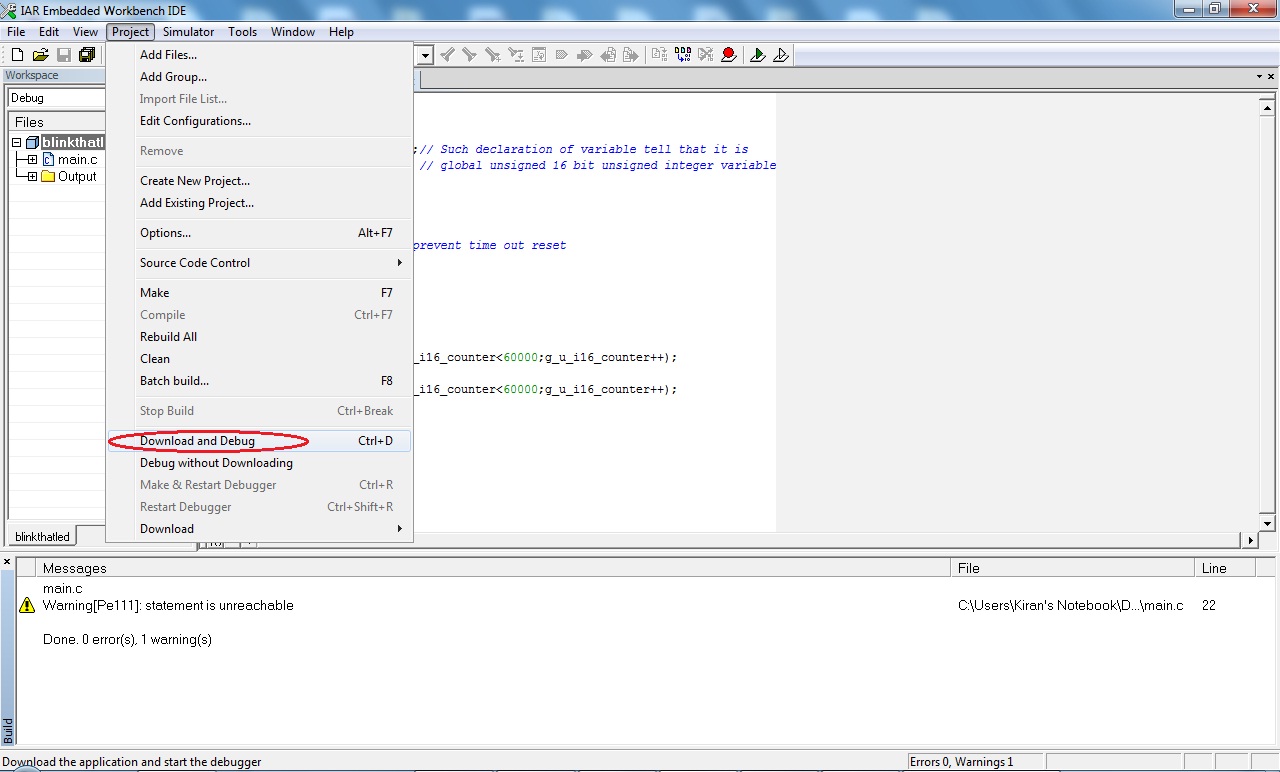
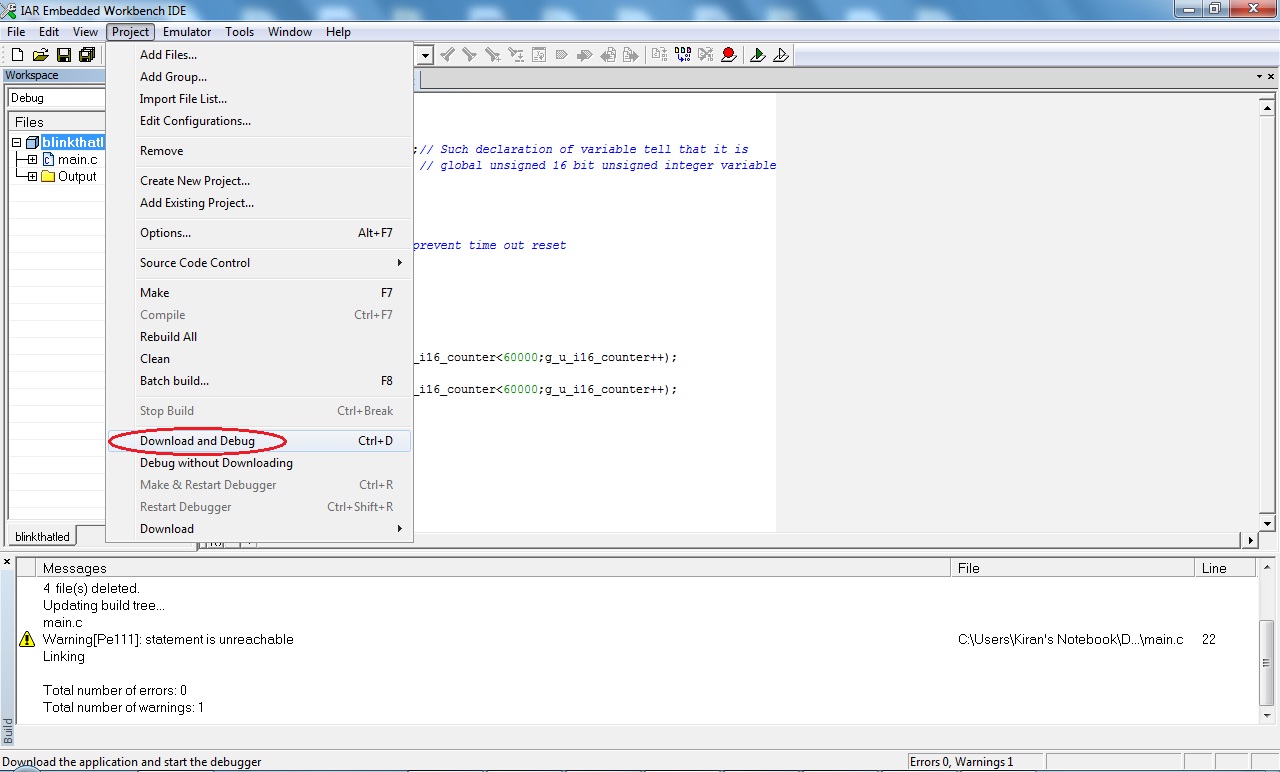
Click on Project->Download & Debug to start Simulation, Debugging or Programming target:
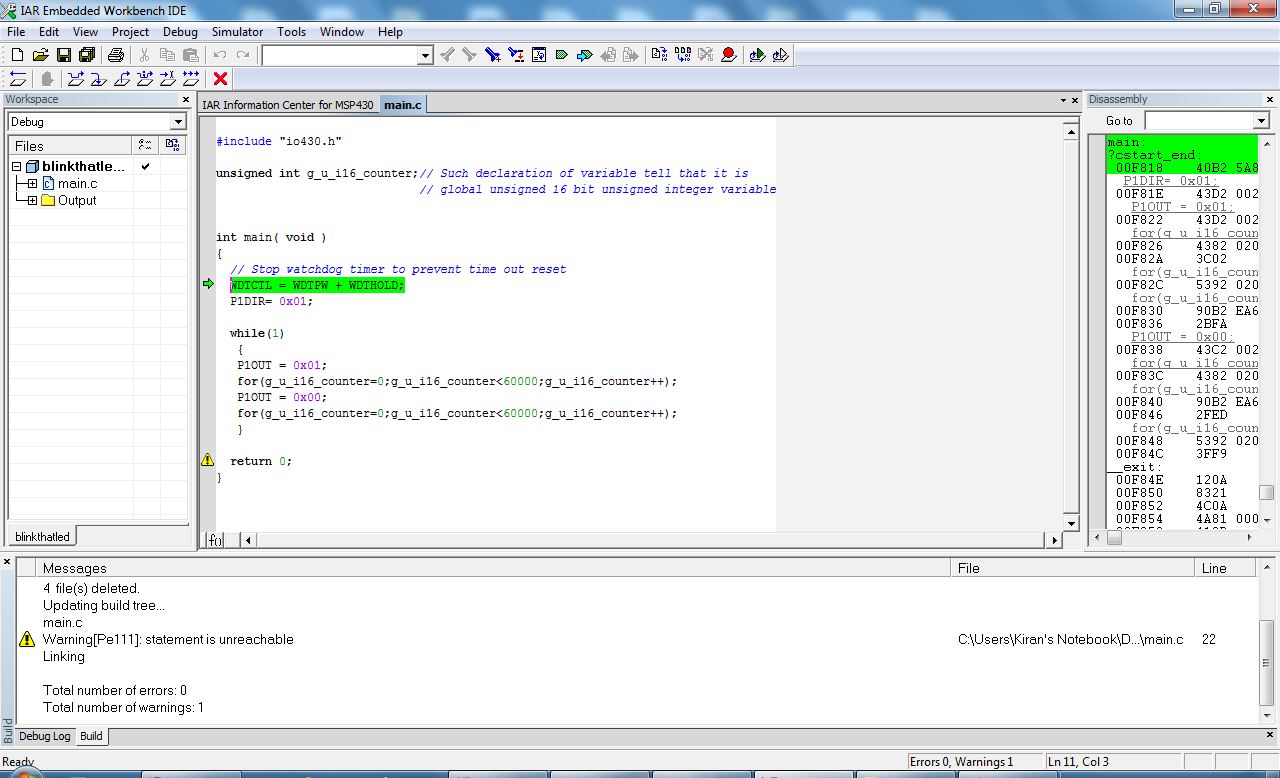
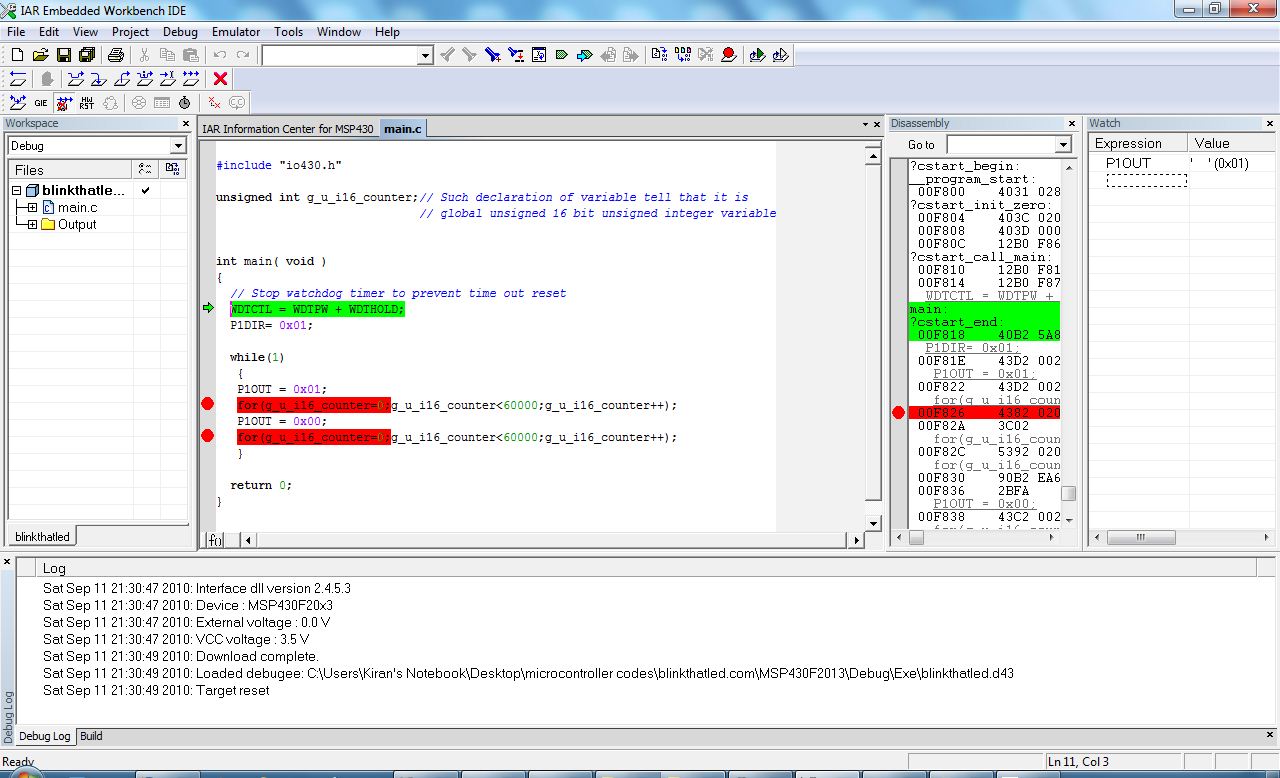
After starting Simulation Code window will have some green highlighted text. Which indicates Code is about to execute:
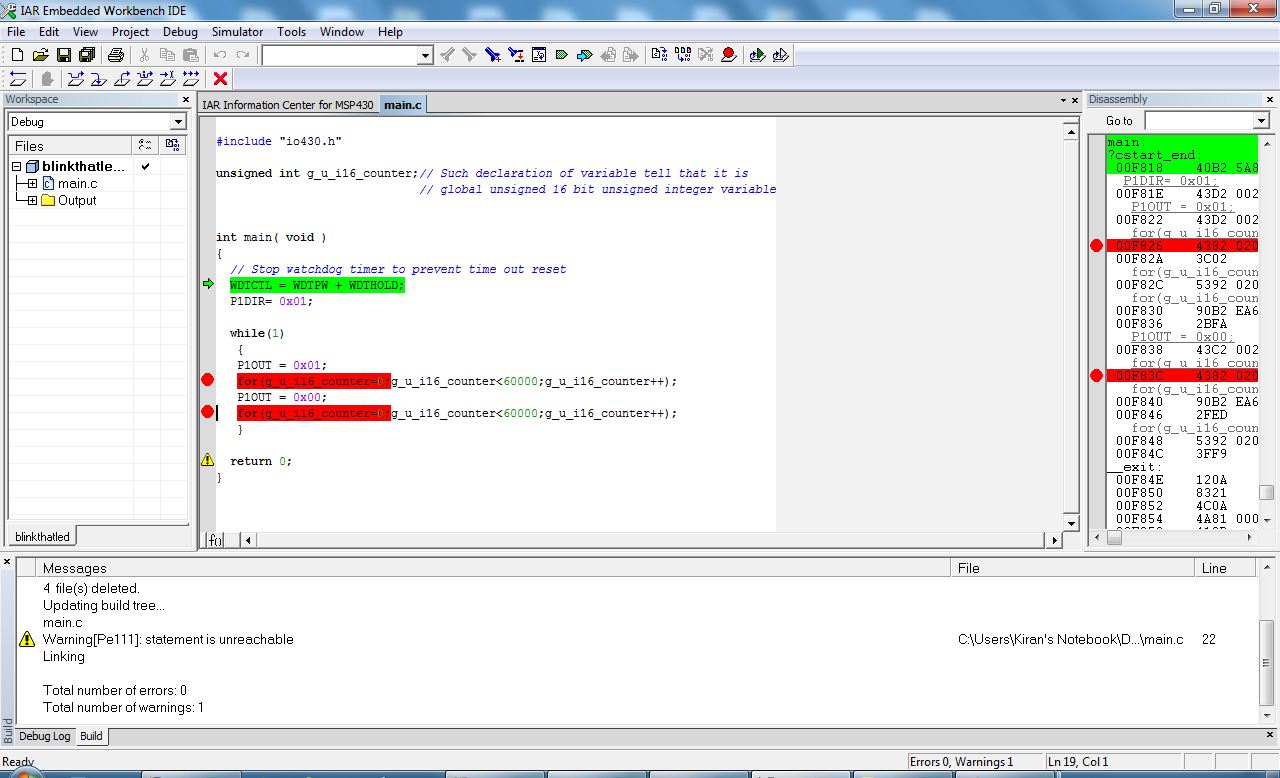
Insert breakpoints by double clicking on gray area on left side of code lines:
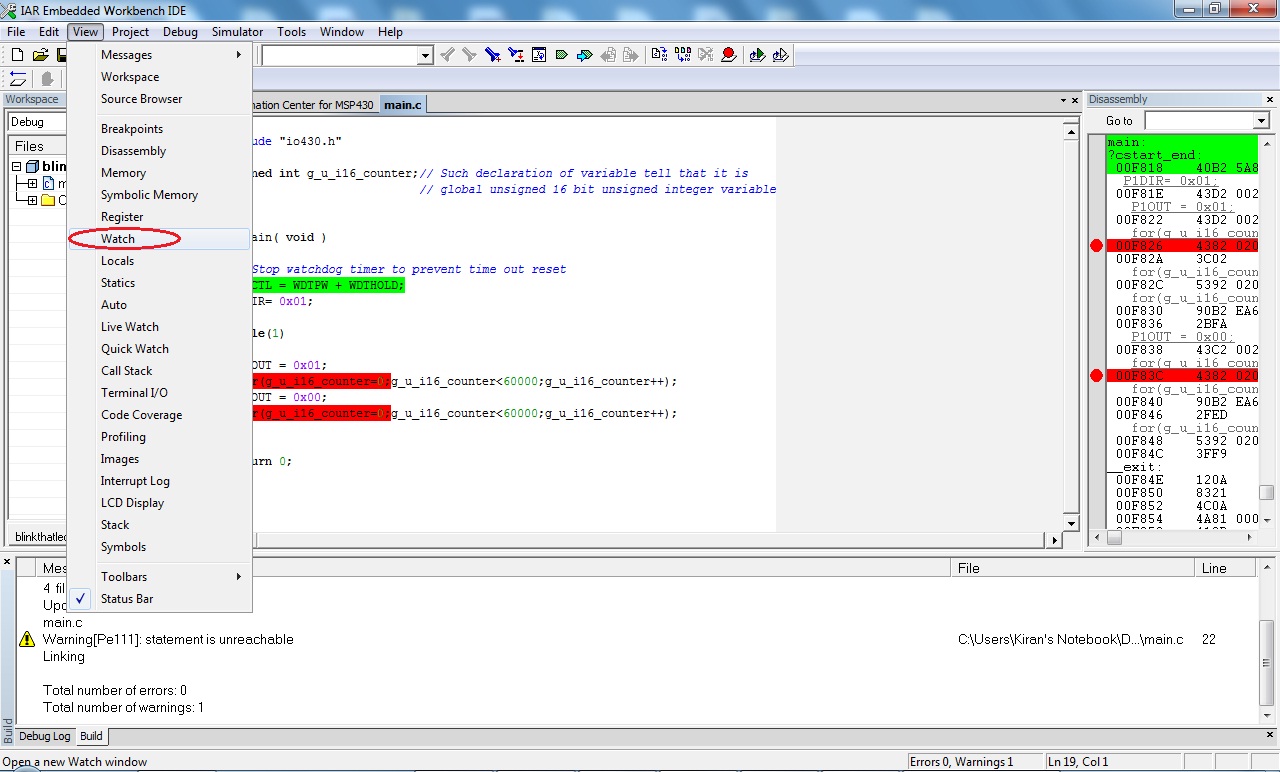
Add watch window to watch the values of Registers and Ports from View menu:
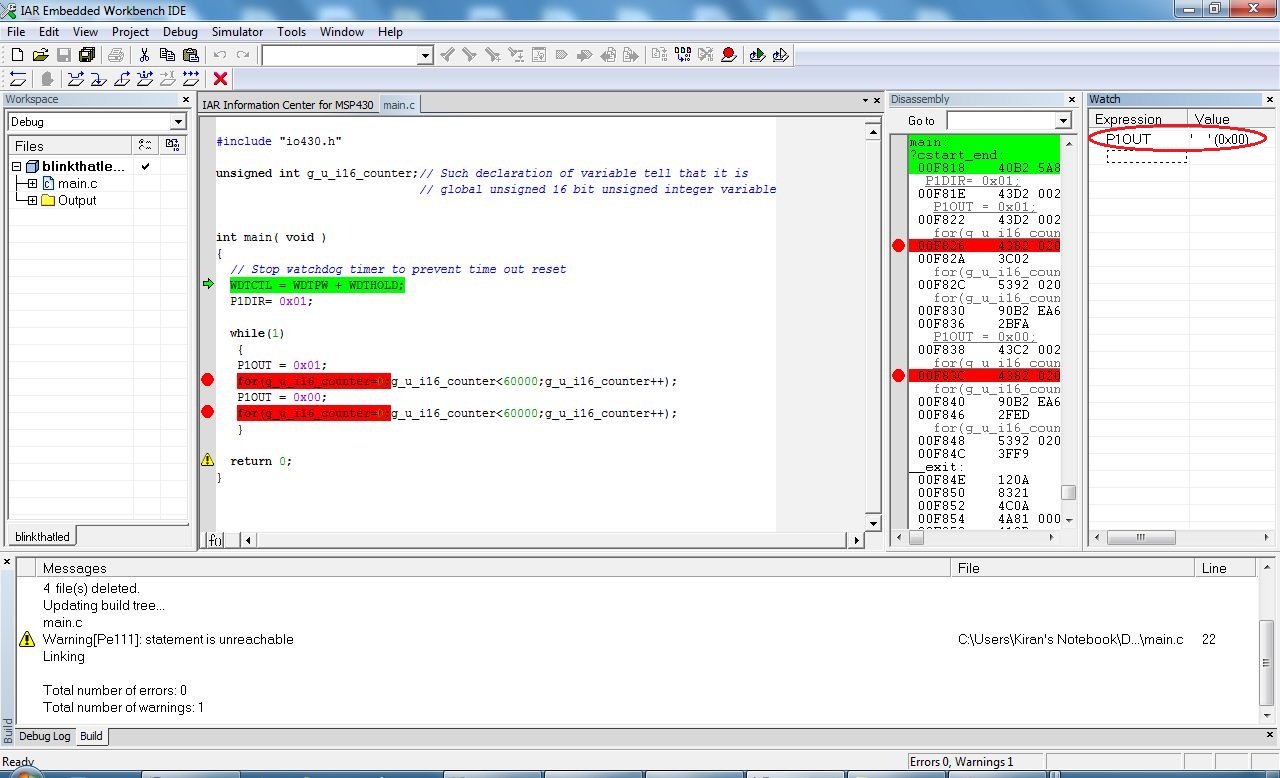
In watch window Enter the name of Port register by clicking and writing name in dotted rectangle:
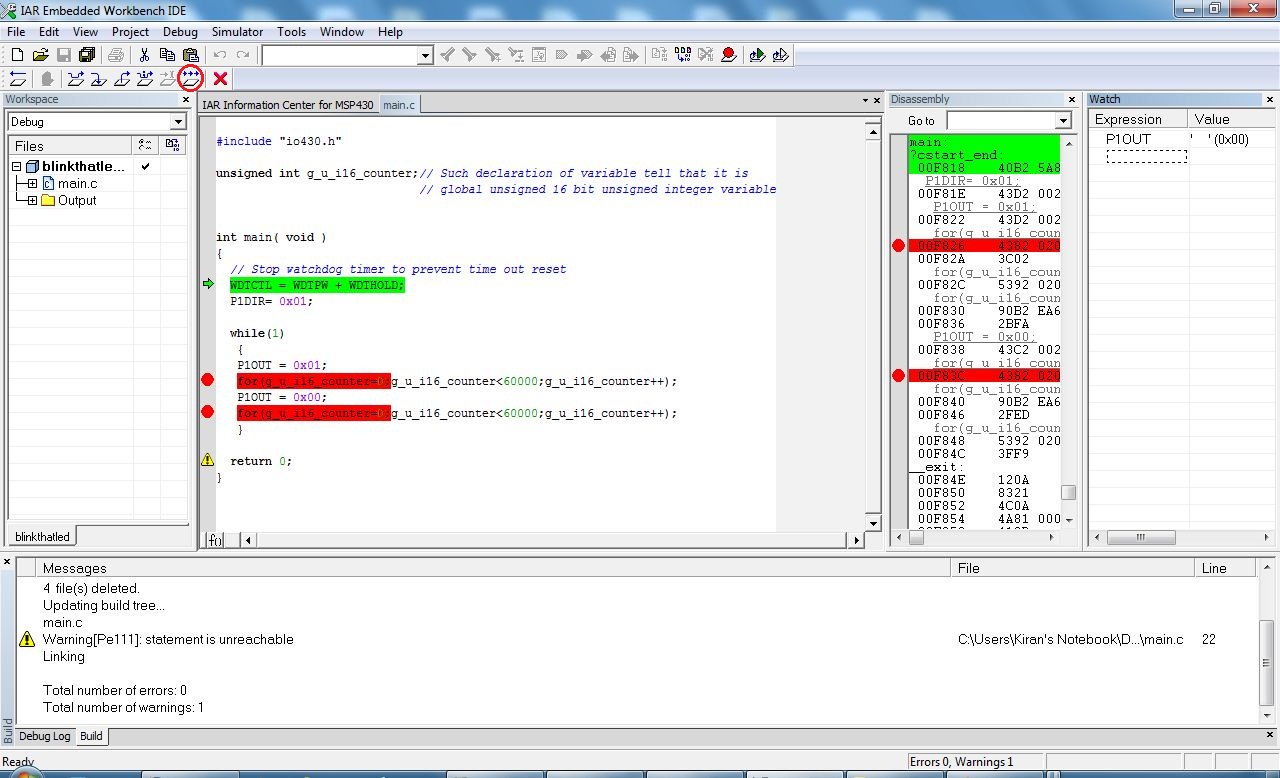
Click on Go to start the execution of code:
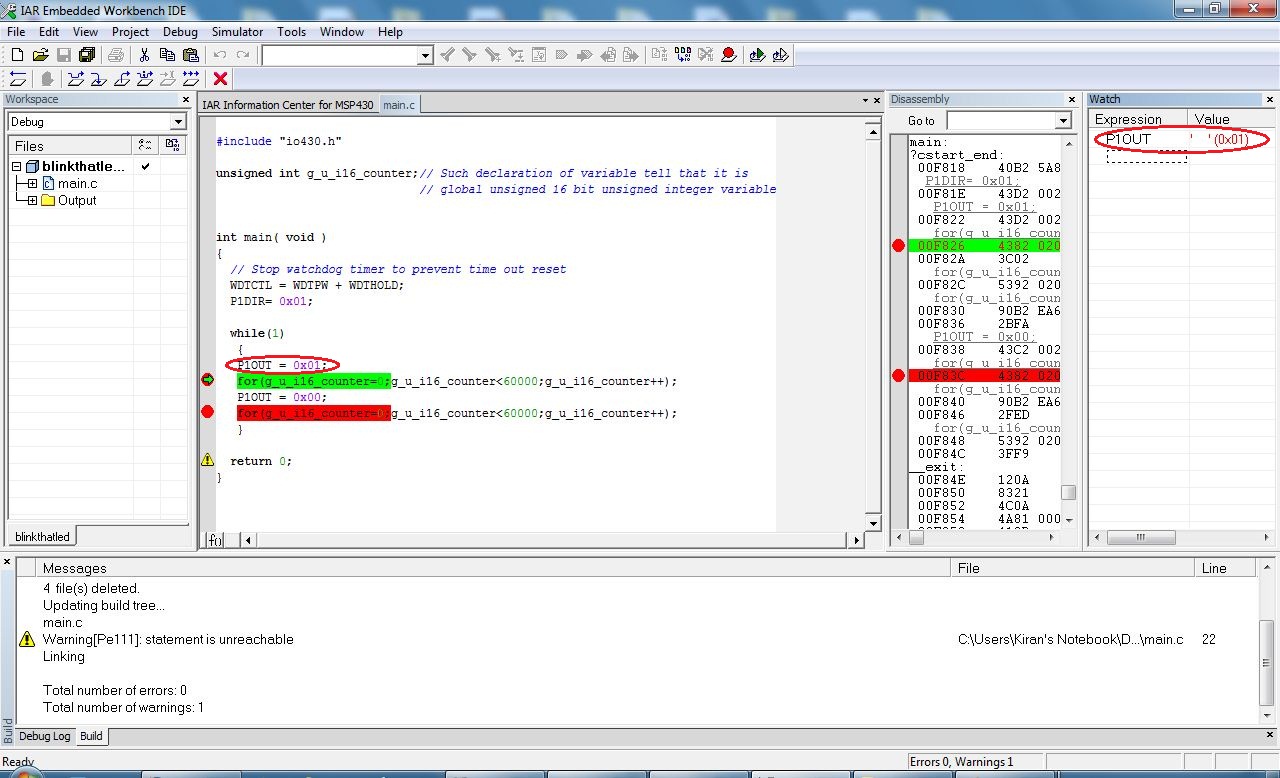
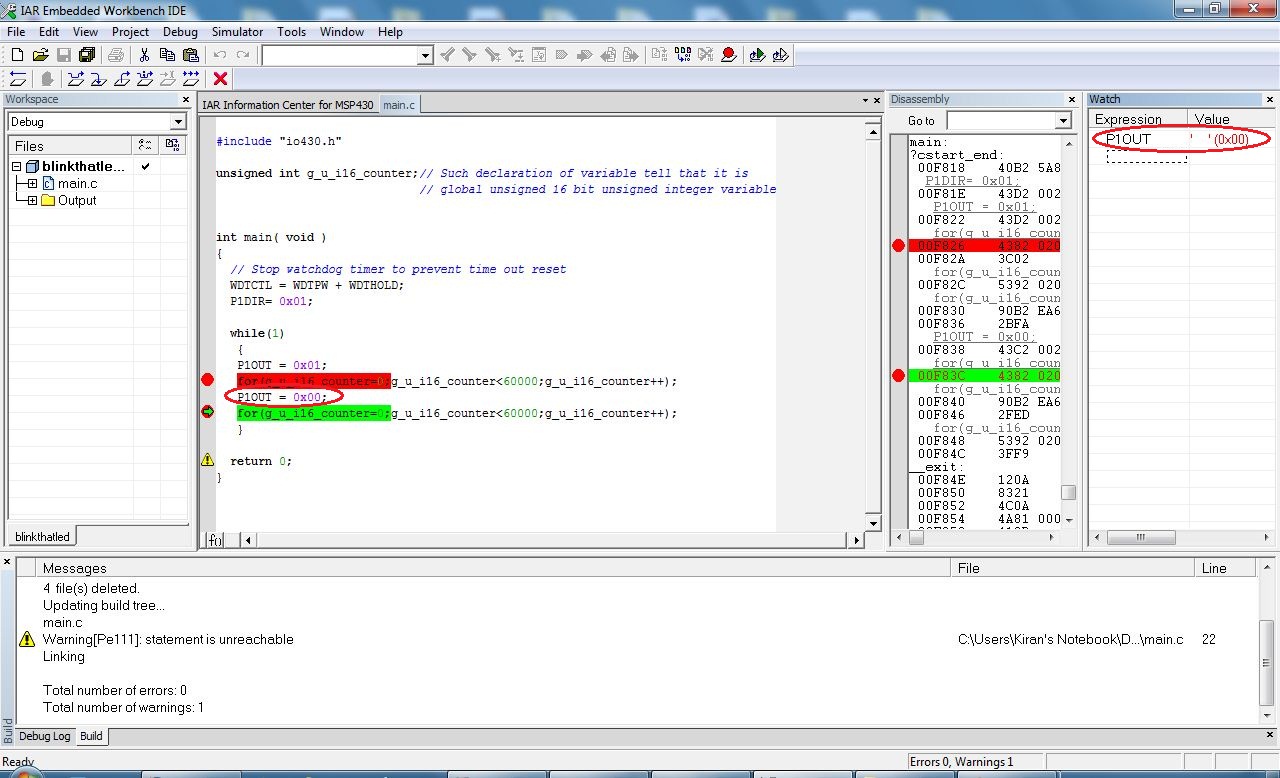
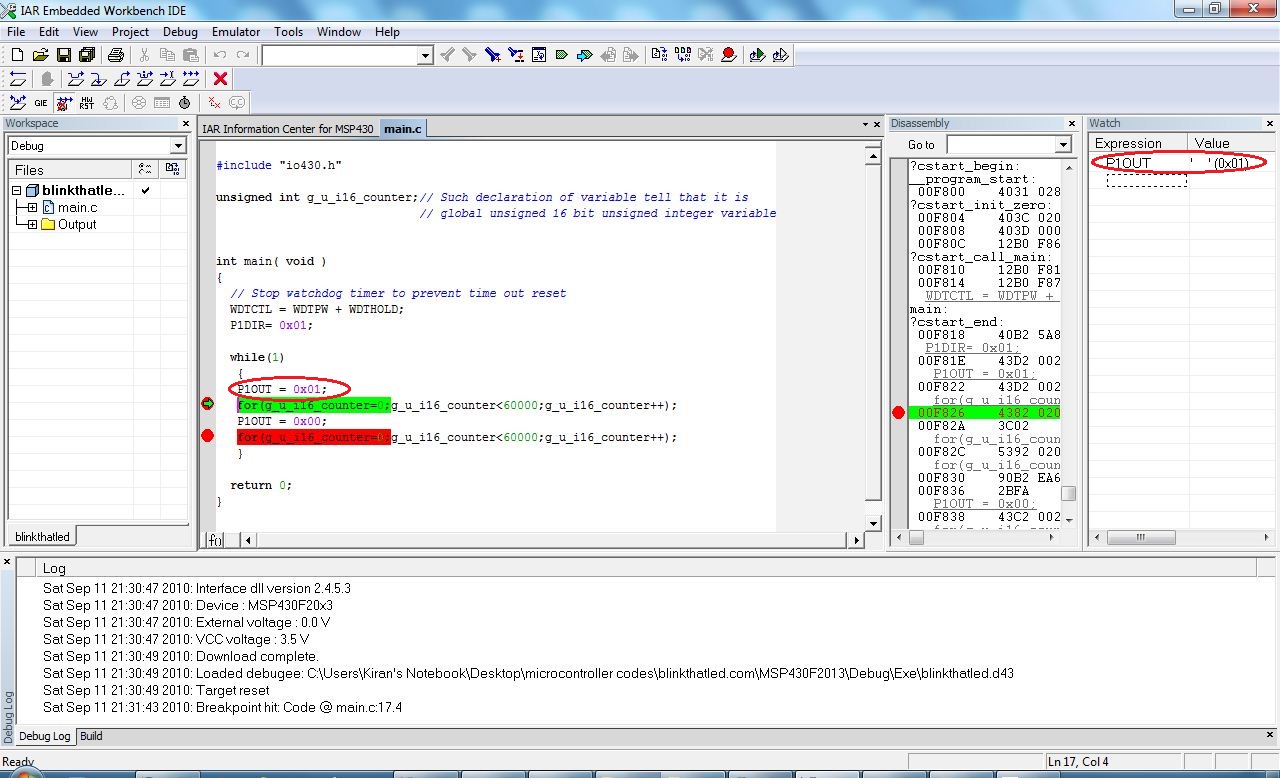
Due to breakpoint process of simulation will get halted. So that we can observe the change in the value of Port 1 register. We can see the value in watch window. The value is 0x01 as per written in code:
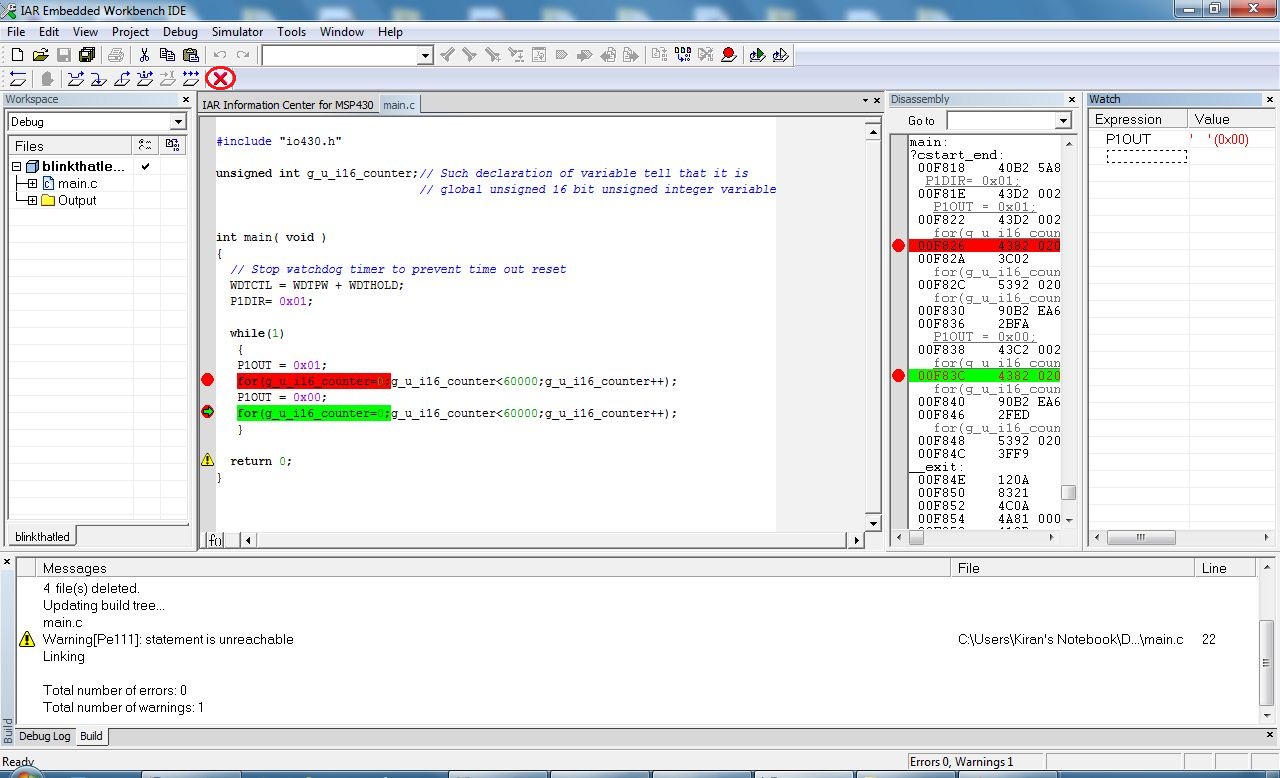
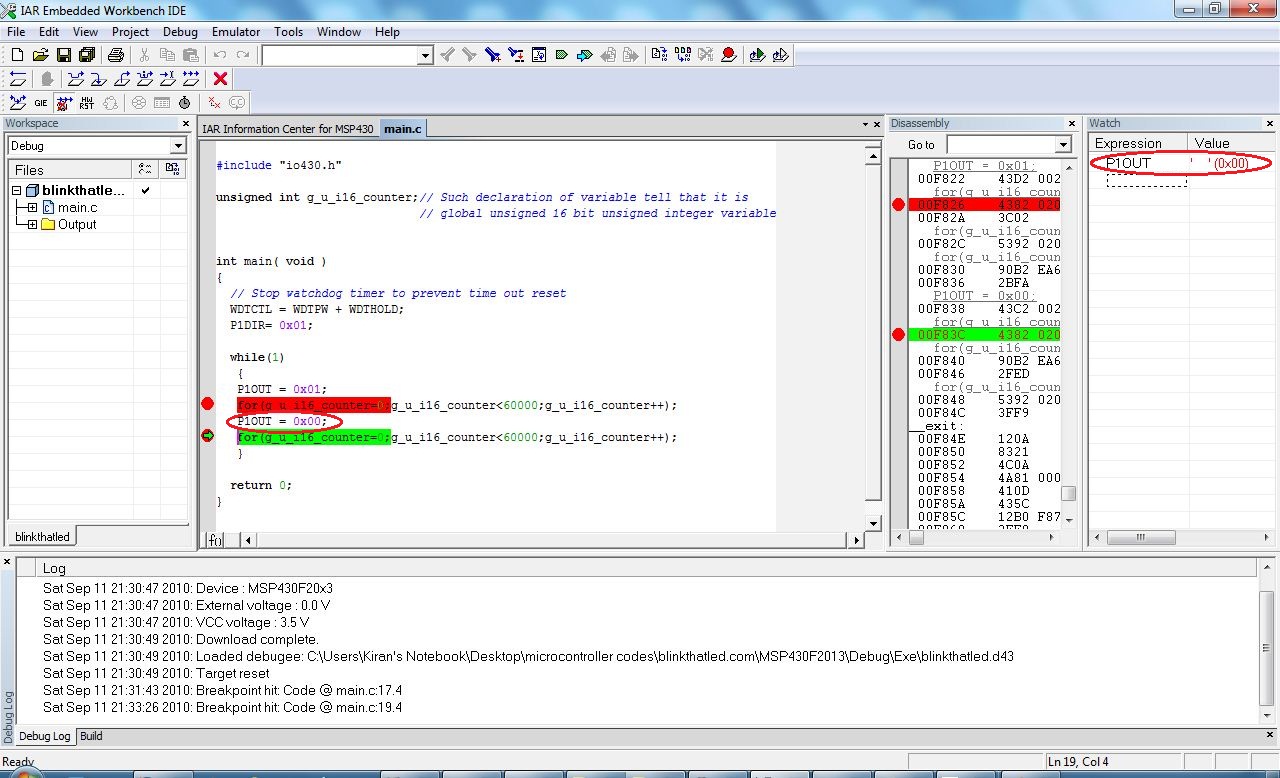
Again click on Go now value of Port 1 register will get changed to 0x00 as per written in the code:
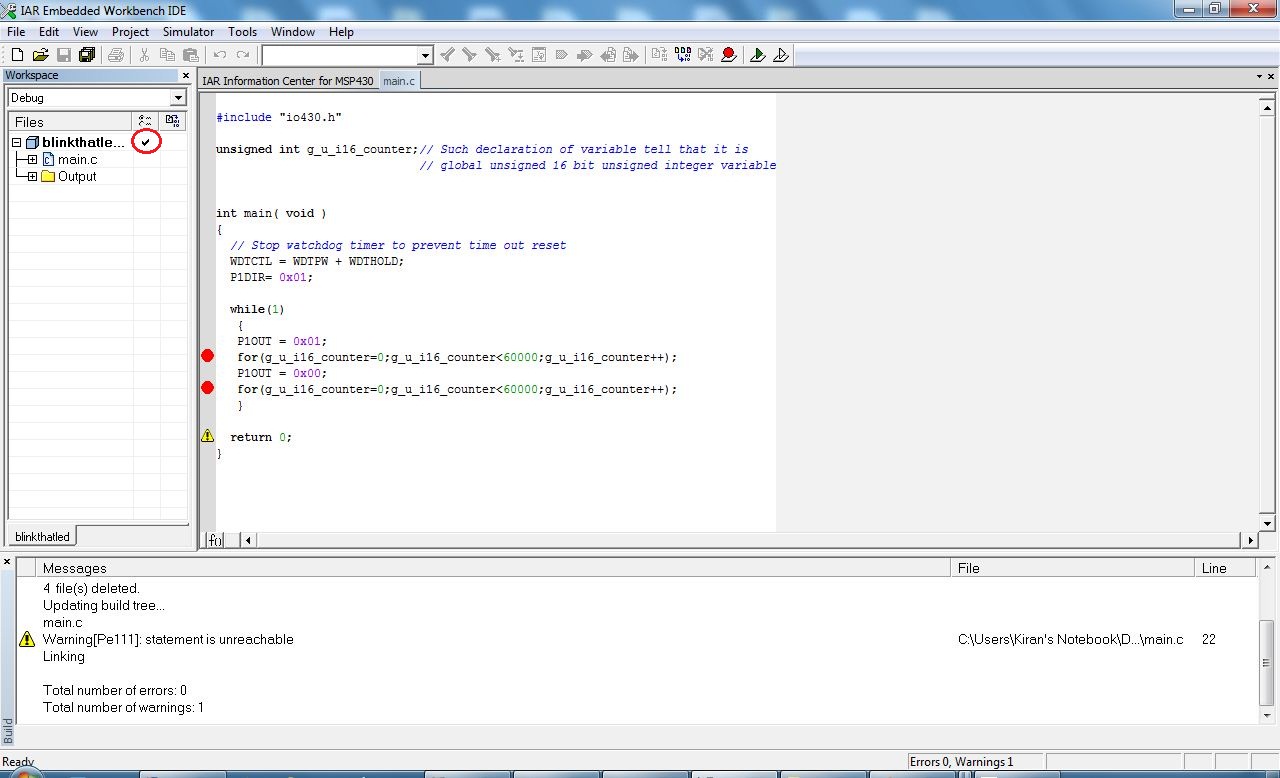
From simulation we can conclude that logically program is working . Now it is time to debug this code on target board. Click on cancel to stop simulation process:
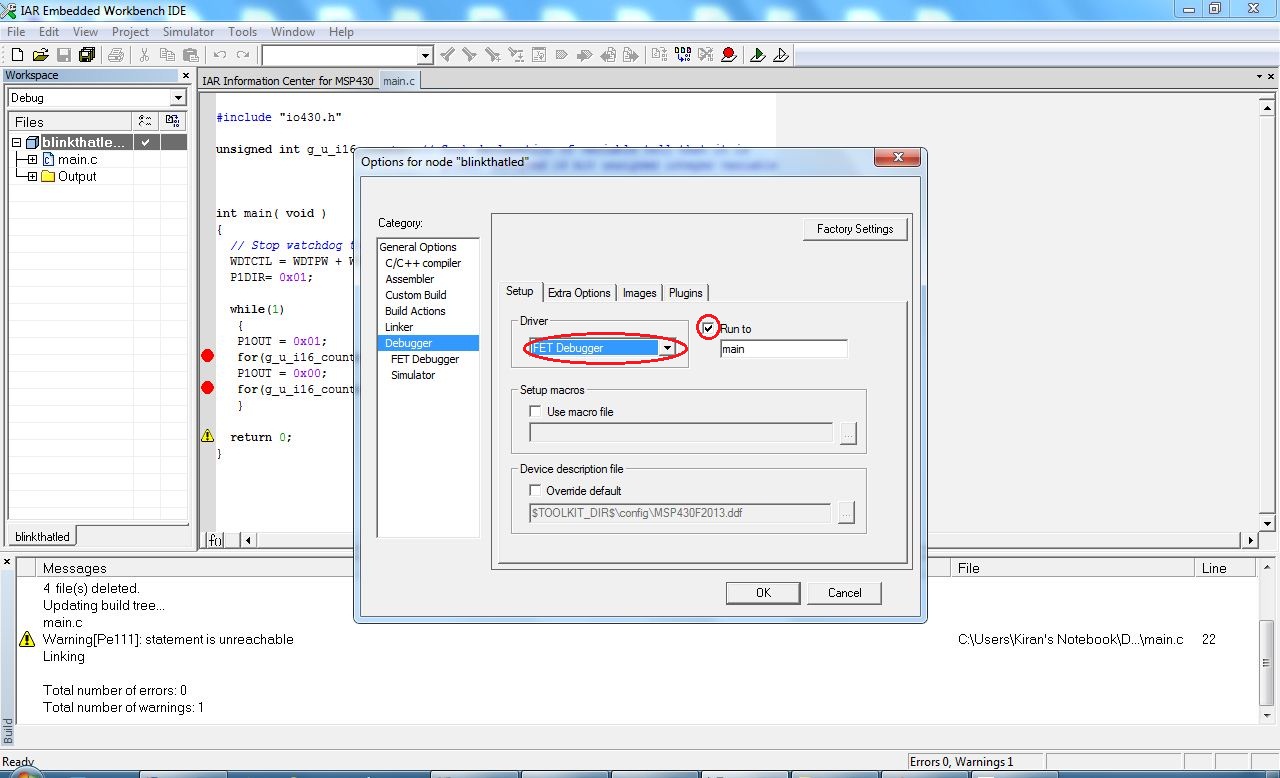
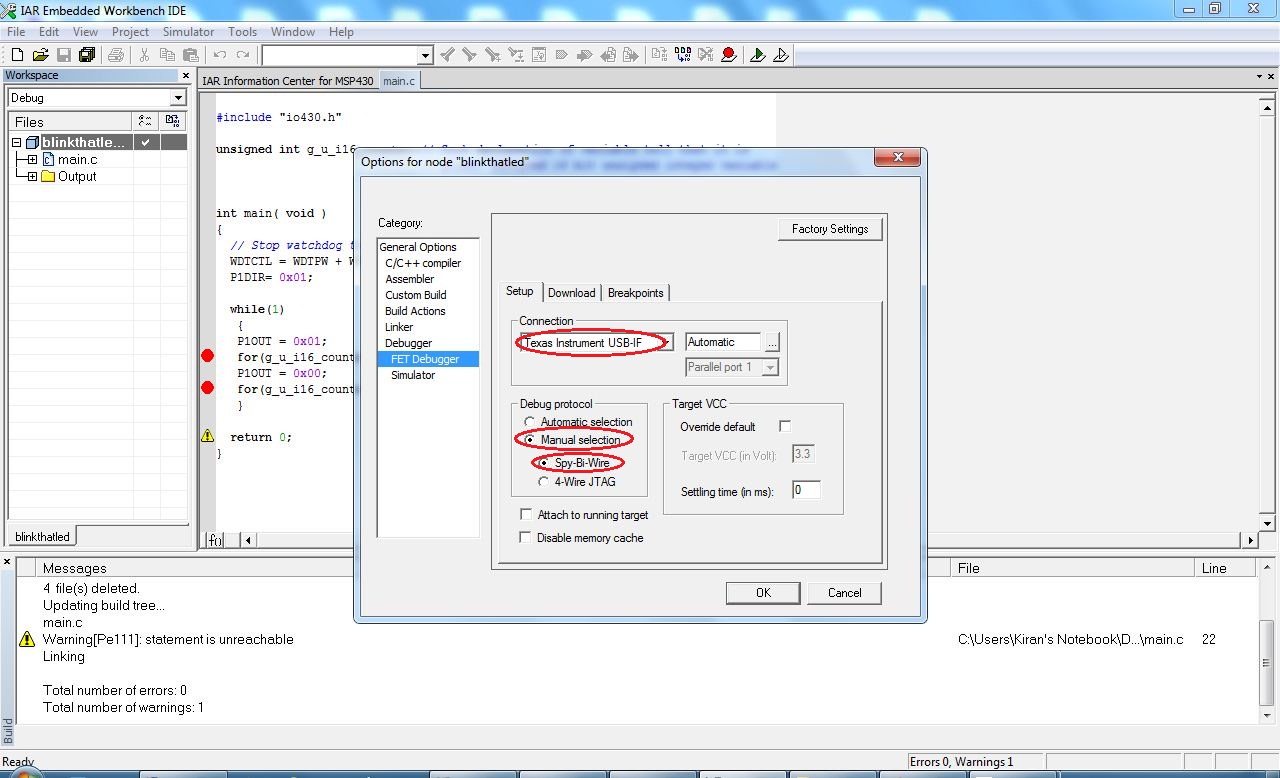
We need to change Simulator tool to Debugger tool from project option:
Choose FET Debugger in Debugger option:
Select Texas Instrument USB-IF in FET Debugger option and Select Automatic. Choose Debug Protocol as Manual Selection and Spy-Bi-Wire:
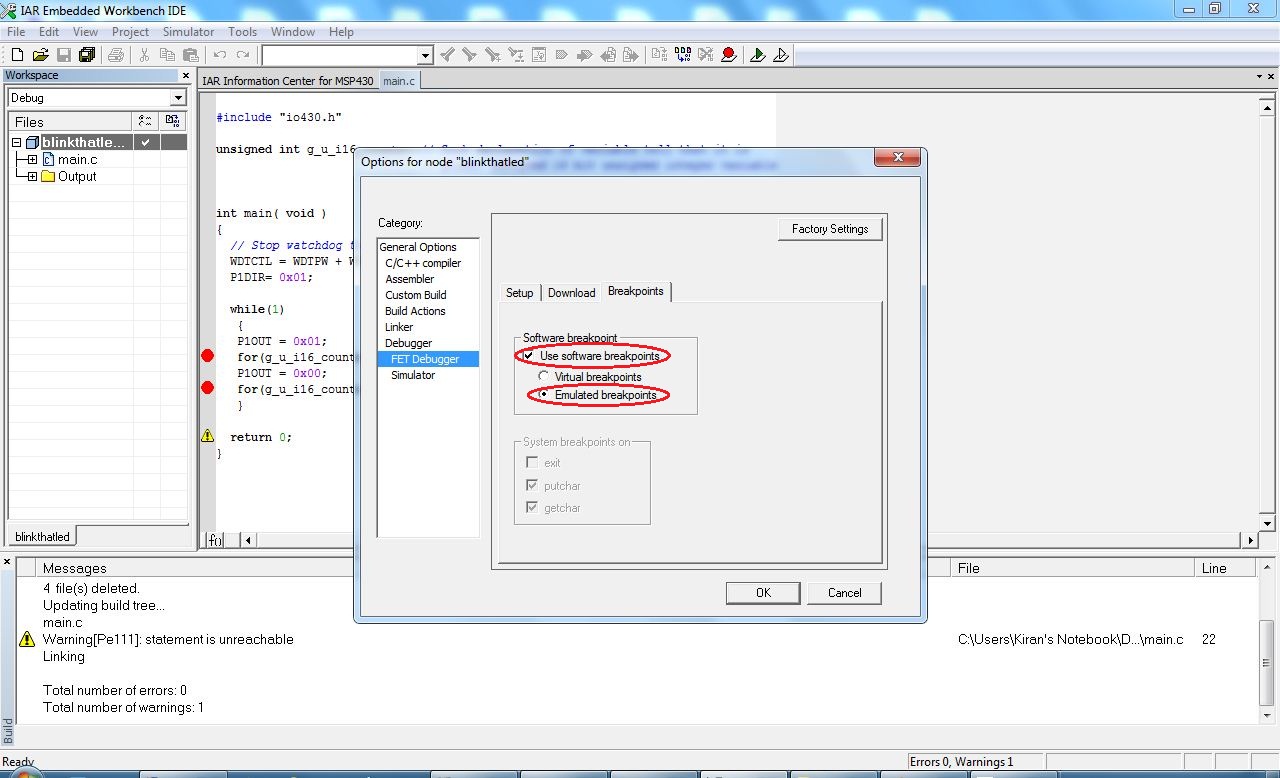
In Breakpoint tab check on Software Breakpoints and Emulated Breakpoints:
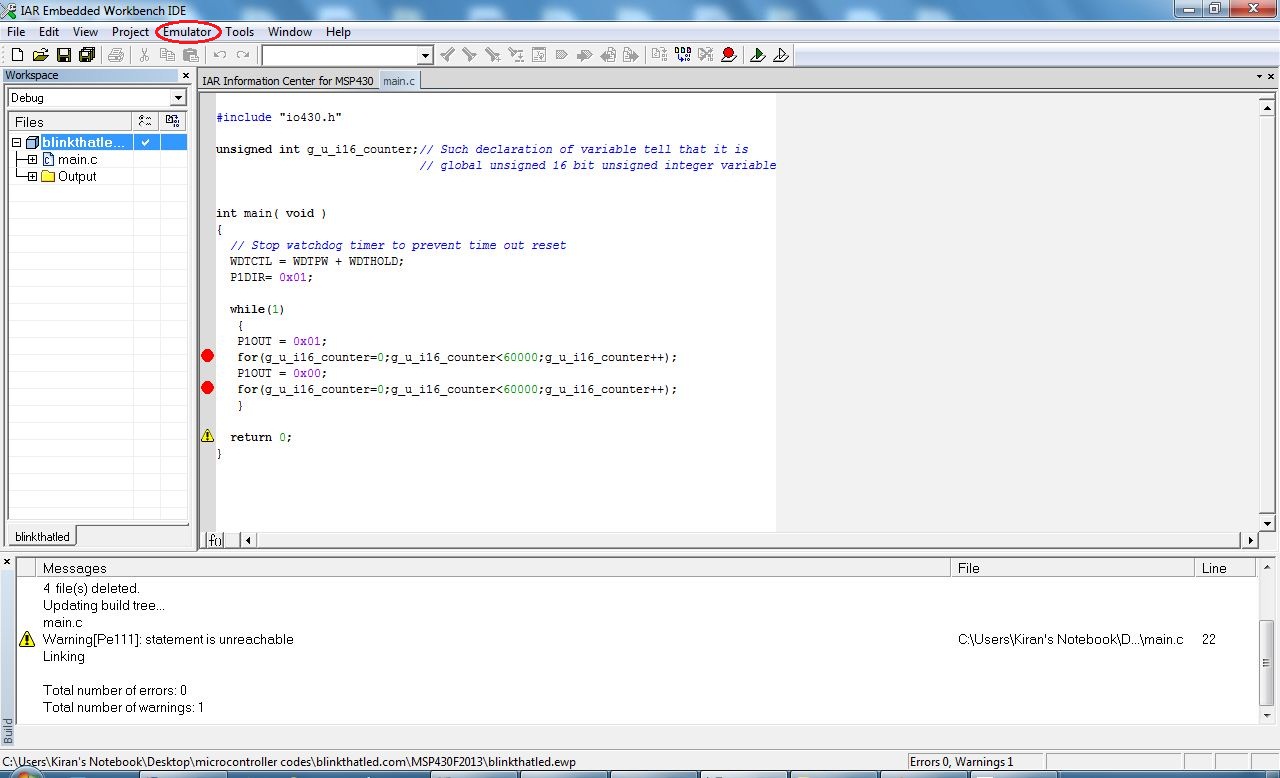
Now simulator menu will get disappear and Emulator Menu will appear:
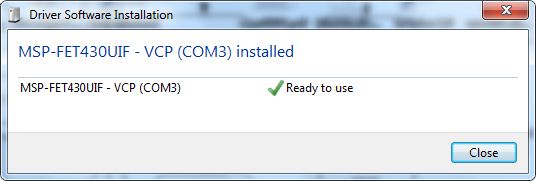
Before starting actual debugging connect target board to USB port of PC and install drivers from Driver directory where IAR IDE is installed. After successful installation such window will appear. After Starting debug if connection error occur then in that case from Device Manager uninstall drivers and reinstall from Driver directory located in IAR installation Directory:
Now click on Project Download & Debug to start programming and debugging on the target board:
You will be able to see the window similar to window appeared while simulating:
Click on Go. Now we can see that the LED on Target board is glowed:
Now we can see that LED is switched off as per mentioned in the code. After debugging cancel debugging and remove target from USB port and reconnect we can see that LED is blinking:
Attachments:
Page updated
Google Sites
Report abuse